Research steps
Bound possible adoption under policy changes
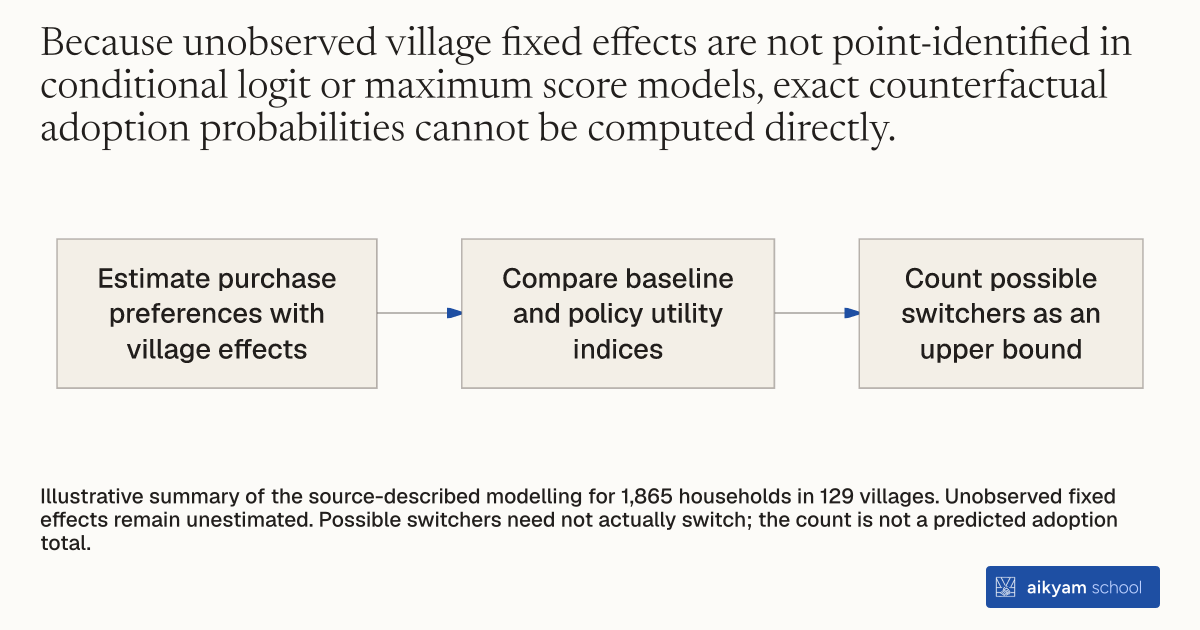
- Estimate purchase preferences with village effects
- Compare baseline and policy utility indices
- Count possible switchers as an upper bound
Illustrative summary of the source-described modelling for 1,865 households in 129 villages. Unobserved fixed effects remain unestimated. Possible switchers need not actually switch; the count is not a predicted adoption total.
See source →How
When to use
Policy evaluators face missing unobserved fixed effects when simulating counterfactual policy changes in panel or cluster choice models. Standard conditional logit and maximum score estimators eliminate unobserved fixed effects to identify utility parameters, but leave the fixed effects unestimated. This technique calculates an upper bound on household behavioral changes caused by policy shifts without relying on arbitrary distributional assumptions about unobserved heterogeneity.
Evaluate the potential impact of policy interventions on discrete technology adoption by deriving analytical upper bounds on household choices in fixed-effects models.
- Estimate utility parameters for technology purchase using a conditional logit or maximum score specification with village fixed effects.
- Evaluate the observable utility index for each household at baseline covariate levels and under counterfactual policy values such as price subsidies or belief shifts.
- Identify non-adopting households whose baseline observable index is negative but whose counterfactual observable index becomes positive.
- Define these transitioning households as switchers who would adopt under the policy change if their unobserved village and household terms fall within the switching interval.
- Count the total number of switching households across the sample to establish an absolute upper bound on adoption increases under the counterfactual regime.
Why it works
Identifying households whose observable utility index crosses zero under the policy shift bounds the maximum possible adoption response regardless of the true fixed effect distribution.
Example
Researchers evaluated counterfactual subsidy and belief policies among 1,865 households across 129 villages in Orissa, India. A 50 percent reduction in bednet price yielded an upper bound of only 4 switching households, whereas a joint 50 percent increase in efficacy beliefs and community ownership perceptions yielded an upper bound of 174 switching households.
About the study
Participants
1,865 households across 129 rural villages in Bargarh, Balangir, Kandhamal, Keonjhar, and Sambalpur districts in Orissa, India, where 93 percent belong to Scheduled Castes, Scheduled Tribes, or Other Backward Castes.
Study Design
Bounding analysis applied to estimated structural discrete choice models under conditional logit and maximum score fixed effects, simulating 50 percent changes in price, bednet efficacy beliefs, and community net ownership perceptions.
Results
Under conditional logit fixed effects, a 50 percent net price drop yielded an upper bound of 4 switching households, a 50 percent increase in efficacy beliefs yielded an upper bound of 23 switching households (1 percent), and combining efficacy and community ownership shifts yielded an upper bound of 174 switching households (10 percent).