Research procedure
Reweight the sample to a national benchmark
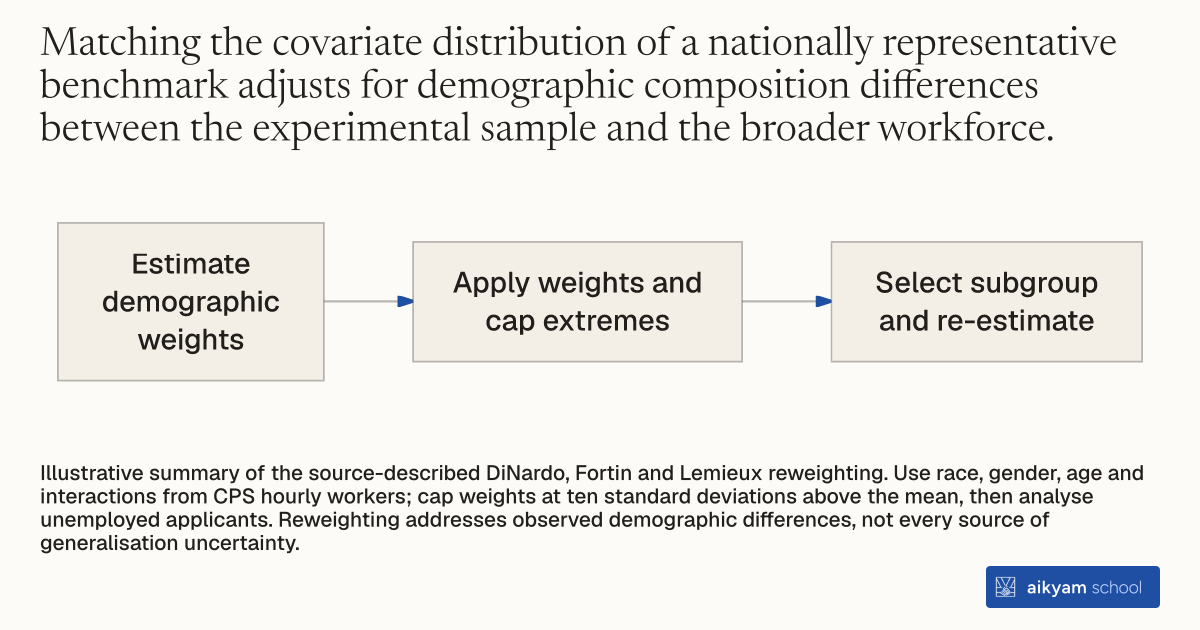
- Estimate demographic weights
- Apply weights and cap extremes
- Select subgroup and re-estimate
Illustrative summary of the source-described DiNardo, Fortin and Lemieux reweighting. Use race, gender, age and interactions from CPS hourly workers; cap weights at ten standard deviations above the mean, then analyse unemployed applicants. Reweighting addresses observed demographic differences, not every source of generalisation uncertainty.
See source →How
When to use
Field experiment samples often over-represent specific demographic groups, such as women or younger workers, compared to the broader national workforce. This creates concerns about whether experimental estimates generalize to national populations. Re-weighting experimental sample data to match national population statistics addresses external validity concerns for economic researchers and policy analysts.
Re-weight experimental survey observations to align sample demographic distributions with national benchmark populations using re-weighting functions.
- Extract demographic microdata including age, gender, race, and education from a national benchmark dataset like the Current Population Survey Merged Outgoing Rotation Groups.
- Estimate propensity score weights using the DiNardo, Fortin, and Lemieux re-weighting method on race categories, gender indicators, age, and interaction terms.
- Apply the estimated sample weights to the full experimental applicant pool.
- Cap sample weights at ten standard deviations above the mean weight to prevent individual outlier observations from dominating the analysis.
- Limit the re-weighted analytical sample to target subgroups like unemployed workers.
- Re-estimate key economic parameters using weighted econometric models.
Why it works
This ensures that parameter estimates reflect national population averages rather than study-specific applicant demographics.
Example
Researchers re-weighted a field experiment sample of 1,152 unemployed applicants that was 83 percent female and 44 percent White using microdata to match the national population of hourly workers that was 50 percent female and 60 percent White. Re-weighting yielded a national non-work time flow value estimate of 0.57, nearly identical to the unweighted estimate of 0.58.
About the study
Participants
N = 1,152 unweighted unemployed applicants re-weighted to match 92,378 hourly workers aged 16 to 64 from the 2016 CPS Merged Outgoing Rotation Groups.
Study Design
DiNardo, Fortin, and Lemieux sample re-weighting using race dummies, female indicators, age, and interaction terms, with weights capped at 10 standard deviations above the mean weight affecting 1 observation.
Results
Unweighted sample estimates yielded an implied flow value of non-work time relative to pre-tax wages of 0.58 (s.e. = 0.04), while the demographically re-weighted sample yielded 0.57 (s.e. = 0.07).