Research calculation
Measure district ethnic diversity
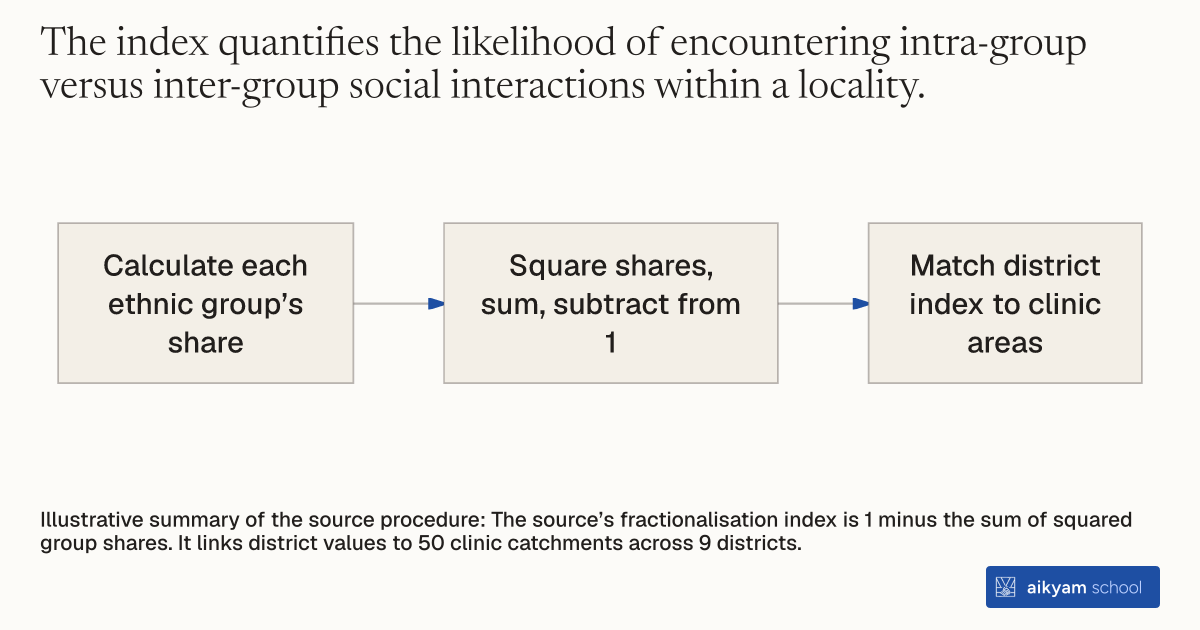
- Calculate each ethnic group’s share
- Square shares, sum, subtract from 1
- Match district index to clinic areas
Illustrative summary of the source procedure: The source’s fractionalisation index is 1 minus the sum of squared group shares. It links district values to 50 clinic catchments across 9 districts.
See source →How
When to use
Community monitoring programs often show wide variation in success across different locations because local social divisions impede collective action. Program managers and researchers need a quantitative measure of local social fragmentation to evaluate how ethnic diversity influences a community's ability to monitor health service providers. This method calculates an index of ethno-linguistic fractionalization at the sub-national level to measure the probability that two randomly chosen individuals belong to different ethnic groups.
Calculate the ethno-linguistic fractionalization index using sub-national population shares across ethnic groups to quantify local ethnic diversity.
- Econometricians obtain ethnic and linguistic demographic composition data at the sub-national district level from sub-national census datasets.
- Econometricians identify the total number of distinct ethnic groups and calculate the population proportion of each ethnic group within the district.
- Econometricians square the population share of each ethnic group in the district.
- Econometricians sum the squared population shares across all ethnic groups in the district.
- Econometricians subtract the sum of squared population shares from 1 to yield the district ethno-linguistic fractionalization index value.
- Evaluation teams match each health facility catchment area to its corresponding district fractionalization index value to analyze heterogeneous community monitoring impacts.
Why it works
Communities with higher ethnic fractionalization lack overarching social networks and cross-group sanctioning norms, making it harder to overcome free-rider problems and organize collective monitoring.
Example
Researchers matched 50 primary health facility catchment areas in 9 rural districts in Uganda with sub-national ethno-linguistic fractionalization data from Alesina and Zhuravskaya (2008). In the baseline data, the ethno-linguistic fractionalization index averaged 0.35 in treatment communities and 0.36 in control communities, enabling researchers to show that higher ethnic fractionalization significantly reduced the treatment effect on community action and health facility utilization.
About the study
Participants
50 primary health facility catchment areas across 9 rural districts in Uganda.
Study Design
Linking sub-national district demographic data to randomized health clinic monitoring trial data and estimating interaction effects using a seemingly unrelated regression system with district fixed effects.
Results
Baseline ethno-linguistic fractionalization averaged 0.35 (standard error 0.03) in treatment districts and 0.36 (standard error 0.03) in control districts; the interaction coefficient of ELF with program impact was -3.05 (standard error 1.43) for the community ACTION index and -754.9 (standard error 613.4) for monthly outpatient care visits.