Research groups
Compare official election returns
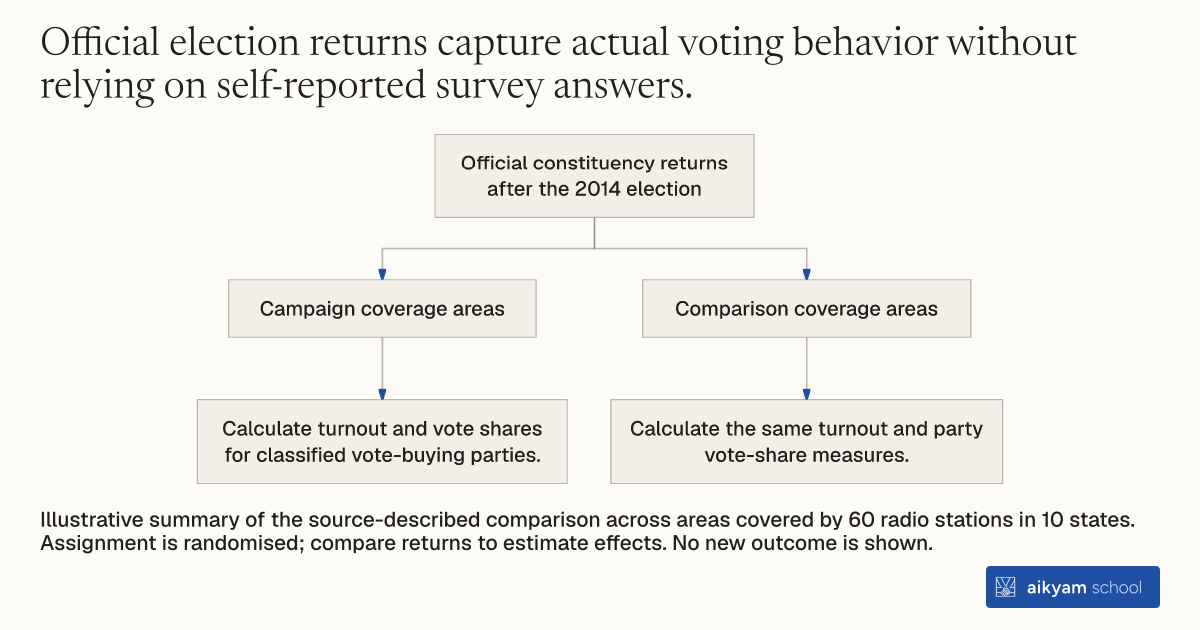
Official constituency returns after the 2014 election
- Campaign coverage areas
- Calculate turnout and vote shares for classified vote-buying parties.
- Comparison coverage areas
- Calculate the same turnout and party vote-share measures.
Illustrative summary of the source-described comparison across areas covered by 60 radio stations in 10 states. Assignment is randomised; compare returns to estimate effects. No new outcome is shown.
See source →How
When to use
Electoral interventions need objective measures to assess whether voter information campaigns shift political behavior. Self-reported voter surveys suffer from social desirability bias and underreporting of corrupt gift acceptance. Analysts evaluate official election returns to measure shifts in party vote shares and voter turnout across treatment and comparison areas.
Compare official election returns between treatment and comparison areas to evaluate campaign impacts on turnout and candidate vote shares.
- Research teams collect official electoral returns for constituencies in randomized campaign treatment and control areas.
- Analysts calculate overall voter turnout across treated and unexposed radio station coverage zones.
- Evaluators aggregate total vote shares for identified vote-buying political parties versus non-vote-buying parties.
- Statisticians compare vote share differences between treatment and control regions to measure candidate switching and campaign persuasion rates.
Why it works
Comparing secret ballot outcomes between randomized broadcast zones provides unbiased estimates of shifts away from corrupt political parties.
Example
Researchers analyzed official election returns from parliamentary constituencies across 60 public radio station areas in 10 Indian states following the 2014 general election.
About the study
Participants
Parliamentary constituencies covered by 60 All India Radio stations across 10 states, covering 67 percent of India's population.
Study Design
Comparison of official constituency election returns between randomized treatment radio station coverage zones and comparison zones.
Results
Broadcasts decreased vote-buying party vote share by 3.5 to 7.1 percentage points with no significant impact on voter turnout, achieving a persuasion rate of 10.3 to 20.8 percent.