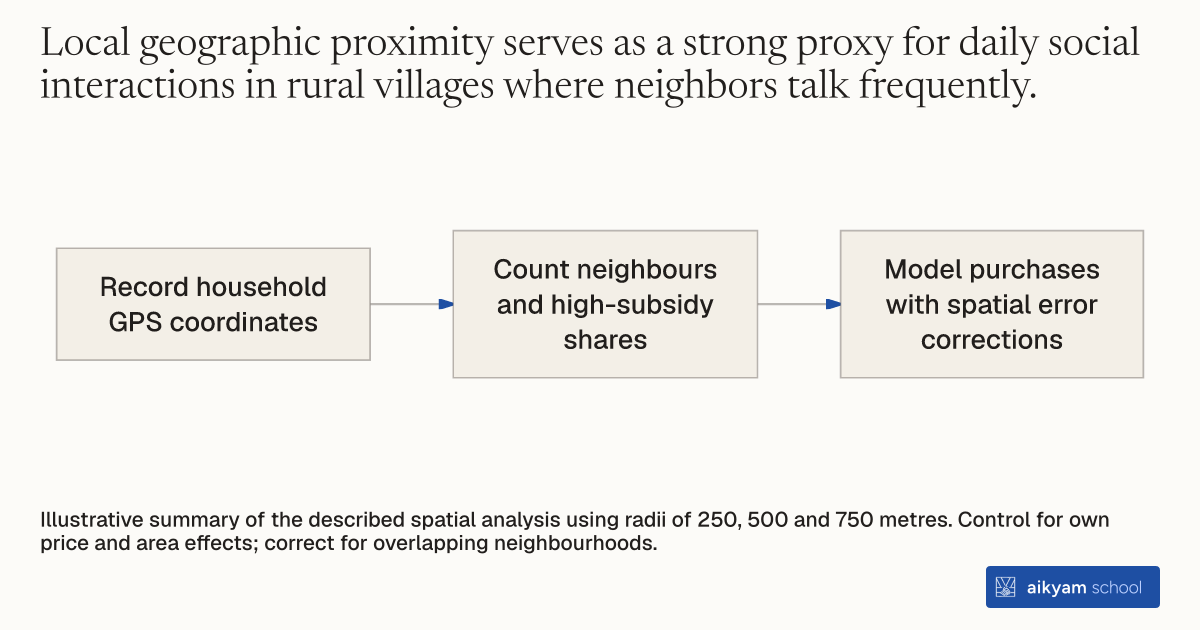
Research steps
Map nearby subsidy exposure
- Record household GPS coordinates
- Count neighbours and high-subsidy shares
- Model purchases with spatial error corrections
Illustrative summary of the described spatial analysis using radii of 250, 500 and 750 metres. Control for own price and area effects; correct for overlapping neighbourhoods.
See source →How
When to use
Health programs need to measure how product adoption diffuses through local peer interactions without relying on subjective network surveys. Geographic variation in treatment assignment creates natural differences in local exposure across nearby households. Mapping precise physical coordinates allows evaluators to identify spatial neighborhood density and quantify peer spillover effects on technology adoption.
Map household spatial locations using Global Positioning System coordinates to calculate neighborhood exposure and measure peer spillovers.
- Record precise spatial coordinates for sampled households during baseline visits using hand-held GPS units.
- Define spatial neighborhood boundaries around each target household using fixed distance radii of 250 meters, 500 meters, and 750 meters.
- Calculate the total number of sampled households and the share receiving high subsidy offers within each household's defined radius.
- Estimate linear probability models regressing individual purchase decisions on local neighbor subsidy density while controlling for own assigned price and area fixed effects.
- Apply spatial dependence corrections to standard errors to account for overlapping geographic neighborhood radii across nearby households.
Why it works
Exogenous variation in neighbor subsidy levels isolates true social spillovers without running into peer reflection problems.
Example
In Busia District, Kenya, researchers mapped 1,094 households using GPS coordinates; having all sampled neighbors within 500 meters receive a high subsidy increased a household's own net purchase probability by 22.3 percentage points.
About the study
Participants
1,094 rural households with valid GIS data across six study areas in Busia District, Western Kenya.
Study Design
Spatial network analysis linking GPS coordinates to randomized voucher assignments, using OLS regressions with Conley spatial-dependence standard errors.
Results
Having 100 percent of neighbors within 500 meters receive a high subsidy increased individual voucher redemption probability by 22.3 percentage points.