Try, learn and adjust
Check real-time price and usage feedback
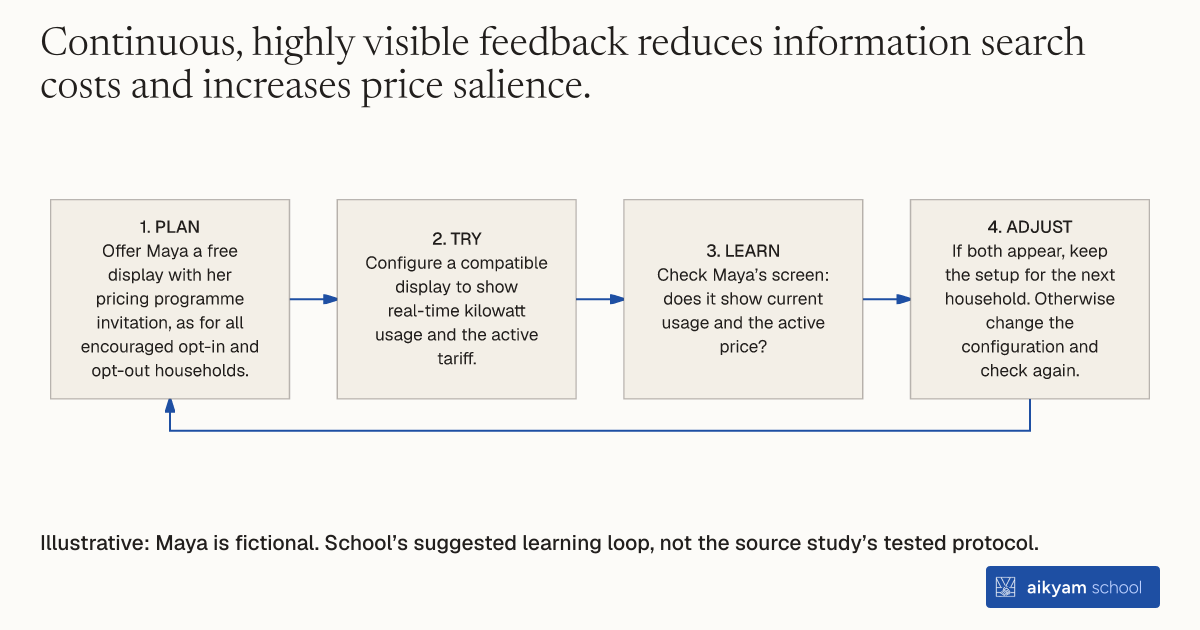
- Plan: Offer Maya a free display with her pricing programme invitation, as for all encouraged opt-in and opt-out households.
- Try: Configure a compatible display to show real-time kilowatt usage and the active tariff.
- Learn: Check Maya’s screen: does it show current usage and the active price?
- Adjust: If both appear, keep the setup for the next household. Otherwise change the configuration and check again.
Illustrative: Maya is fictional. School’s suggested learning loop, not the source study’s tested protocol.
See source →Observe current usage and price on the display. This check does not establish electricity savings. School’s suggested learning loop; not a tested source procedure.
How
When to use
Public utilities and program managers need to enhance consumer awareness and responsiveness under dynamic electricity pricing tariffs. Standard price offers alone may lack continuous visibility during daily usage routines, so providing real-time enabling information technology directly inside the home gives households immediate feedback on current electricity prices and instantaneous power consumption.
Provide and install in-home displays to deliver real-time pricing and usage feedback to participating residential households.
- Program administrators procure compatible in-home display devices capable of wireless communication with smart utility meters.
- Recruitment teams include an offer for a free in-home display within all opt-in and opt-out pricing program solicitation packets mailed to eligible households.
- Utility technicians or fulfillment vendors distribute and configure the in-home displays for households that accept the device offer or enroll in the pricing plan.
- Program systems stream real-time kilowatt usage and active tariff rates to the device screen throughout the pilot period.
Why it works
This helps households monitor real-time consumption and execute timely electricity reductions during high-price peak hours.
Example
SMUD offered free in-home displays providing real-time pricing and consumption data to all encouraged residential treatment groups in Sacramento, California, supporting peak demand reductions of up to 0.658 kW per household.
About the study
Participants
Offered across treatment groups drawn from 174,000 eligible residential utility households in Sacramento, California.
Study Design
Randomized controlled trial offering free enabling technology to encouraged households across Critical Peak Pricing and Time-of-Use experimental arms.
Results
All encouraged opt-in and opt-out households were offered enabling technology in-home displays, supporting peak demand reductions ranging from 0.105 kW to 0.658 kW per household across rate structures.