Research design
Compare three matching ratios
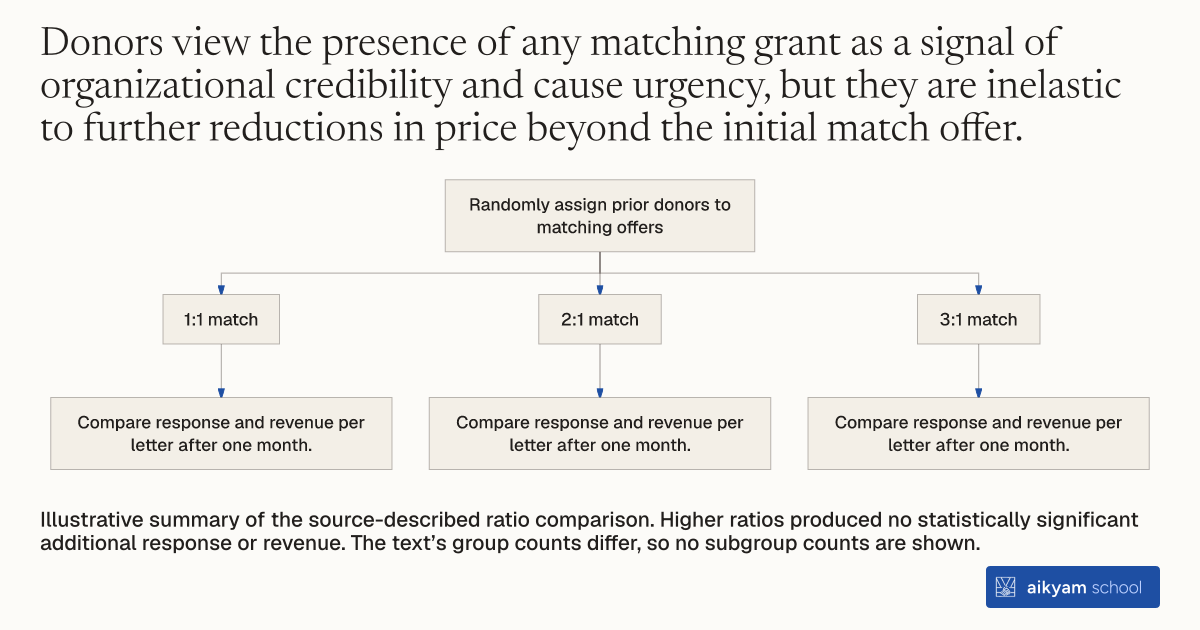
Randomly assign prior donors to matching offers
- 1:1 match
- Compare response and revenue per letter after one month.
- 2:1 match
- Compare response and revenue per letter after one month.
- 3:1 match
- Compare response and revenue per letter after one month.
Illustrative summary of the source-described ratio comparison. Higher ratios produced no statistically significant additional response or revenue. The text’s group counts differ, so no subgroup counts are shown.
See source →How
When to use
Fundraisers often consider offering higher matching grant ratios, such as 2:1 or 3:1 instead of a standard 1:1 match, hoping to increase donor response rates or total revenue per letter. However, securing larger matching commitments requires greater sponsor resources. Testing different match ratios allows charities to evaluate whether escalating price subsidies generates additional donor participation.
Test higher matching grant ratios against a standard 1:1 ratio in direct mail solicitations.
- Secure matching pledge commitments from major donors that allow testing multiple match multipliers.
- Divide the matching grant direct mail recipient pool into equal random treatment sub-groups.
- Assign one sub-group a 1:1 match ratio, where the charity receives \$1 for every \$1 donated.
- Assign a second sub-group a 2:1 match ratio, where the matching donor contributes \$2 for every \$1 donated.
- Assign a third sub-group a 3:1 match ratio, where the matching donor contributes \$3 for every \$1 donated.
- Print the specific match ratio clearly in the text of the solicitation letter and on the reply card.
- Compare donation probabilities and revenue per letter across the match ratio sub-groups after one month.
Example
A civil liberties non-profit in the United States mailed solicitations with 1:1, 2:1, and 3:1 match ratios to 33,396 past donors divided into three equal sub-groups of roughly 11,133 each. The 1:1, 2:1, and 3:1 treatments produced virtually identical response rates (2.1 percent, 2.3 percent, and 2.3 percent) and unconditional revenue per letter (\$0.94, \$1.03, and \$0.94).
About the study
Participants
33,396 prior donors to a US civil liberties nonprofit, randomly assigned into three equal groups of 11,133 for 1:1 ratio, 11,134 for 2:1 ratio, and 11,129 for 3:1 ratio.
Study Design
Randomized natural field experiment testing 1:1, 2:1, and 3:1 match ratios across direct mail solicitations sent in August 2005.
Results
Increasing the match ratio from 1:1 to 2:1 or 3:1 generated no statistically significant increase in response rates (2.1 percent for 1:1, 2.3 percent for 2:1, 2.3 percent for 3:1) or unconditional dollars given (\$0.937 for 1:1, \$1.026 for 2:1, \$0.938 for 3:1).