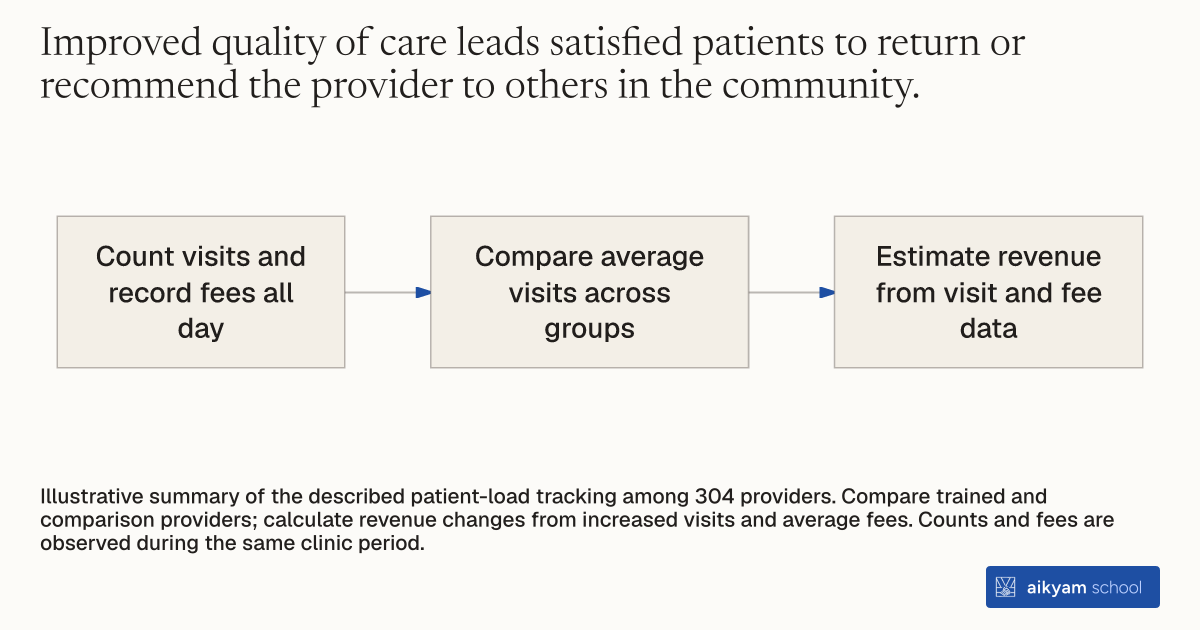
Research steps
Measure patient demand and provider revenue
- Count visits and record fees all day
- Compare average visits across groups
- Estimate revenue from visit and fee data
Illustrative summary of the described patient-load tracking among 304 providers. Compare trained and comparison providers; calculate revenue changes from increased visits and average fees. Counts and fees are observed during the same clinic period.
See source →How
When to use
Skill development programs for informal providers need to evaluate whether improved quality of care translates into higher community demand and provider earnings. Simply measuring clinical knowledge fails to show whether trained practitioners attract more patients or earn enough extra income to offset training costs. Evaluators track daily patient visits and fees charged to assess changes in patient demand and calculate revenue growth.
Track daily patient visits and consultation fees across trained and untrained informal healthcare providers to measure shifts in community demand and earnings.
- Assign trained enumerators to conduct full-day clinic observations at provider locations.
- Count the total number of patient visits during each full-day observation period.
- Record the consultation and treatment fees charged to each visiting patient.
- Compare average daily patient loads between trained providers and comparison providers.
- Calculate changes in provider revenue by multiplying increased patient visits by average fee amounts.
Why it works
Hearing about the provider's formal training also attracts new patients seeking better medical services.
Example
In West Bengal, India, researchers tracked patient visits and fees across 304 informal healthcare providers. Trained providers saw 9.2 patients per day compared to 8.4 patients per day in the comparison group, representing a nearly ten percent increase in patient load.
About the study
Participants
304 informal healthcare providers across 203 communities in West Bengal, India.
Study Design
Randomized evaluation using day-long direct clinical observations to measure daily patient visits and fees charged across treatment and control groups.
Results
Daily patient load increased nearly ten percent from 8.4 patients per day in the comparison group to 9.2 patients per day among trained providers, generating revenue gains that cover training costs within 66 to 210 days.