Research records
Compare early and delayed branch openings
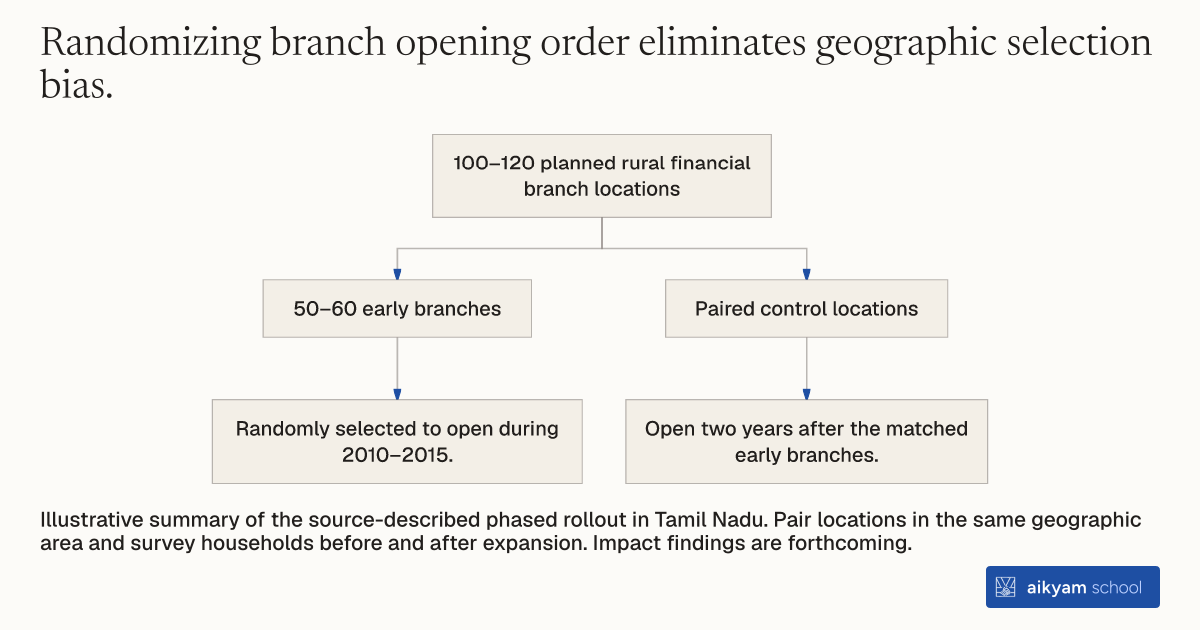
100–120 planned rural financial branch locations
- 50–60 early branches
- Randomly selected to open during 2010–2015.
- Paired control locations
- Open two years after the matched early branches.
Illustrative summary of the source-described phased rollout in Tamil Nadu. Pair locations in the same geographic area and survey households before and after expansion. Impact findings are forthcoming.
See source →How
When to use
Evaluating the impact of rural microfinance branch expansion requires isolating cause and effect from outside economic changes. Non-randomized expansion creates selection bias because organizations open branches in richer or accessible communities first. Staggering branch openings randomly across communities allows researchers to measure true program impacts.
Randomize the opening schedule of planned rural financial service branches to create paired control groups.
- Identify 100 to 120 planned new rural financial service branch locations.
- Randomly select 50 to 60 branches for immediate opening between 2010 and 2015.
- Pair each early-opening branch with a control branch location in the same geographic area.
- Delay opening branches in the control areas for two years after treatment branch openings.
- Survey households in catchment areas of early and delayed branches before and after expansion.
Why it works
Comparing early expansion areas with delayed expansion areas isolates the specific effects of financial access from broader regional economic trends.
Example
Researchers partnered with Kshetriya Grameen Financial Services in Tamil Nadu to randomly select 50 to 60 branches for immediate opening out of 100 to 120 planned sites while delaying control branch expansion by two years.
About the study
Participants
4,500 to 5,500 rural households across catchment areas of 100 to 120 planned financial service branches in Thanjavur, Tamil Nadu, India.
Study Design
Phased randomized controlled trial with paired treatment and two-year delayed control branches evaluated using baseline and endline household surveys.
Results
Per capita income in Tamil Nadu was US\$1,271 in 2008 with 27 percent formal credit access in 2003, while specific impact metrics are listed as forthcoming.