Research analysis
Build wealth indices from baseline assets
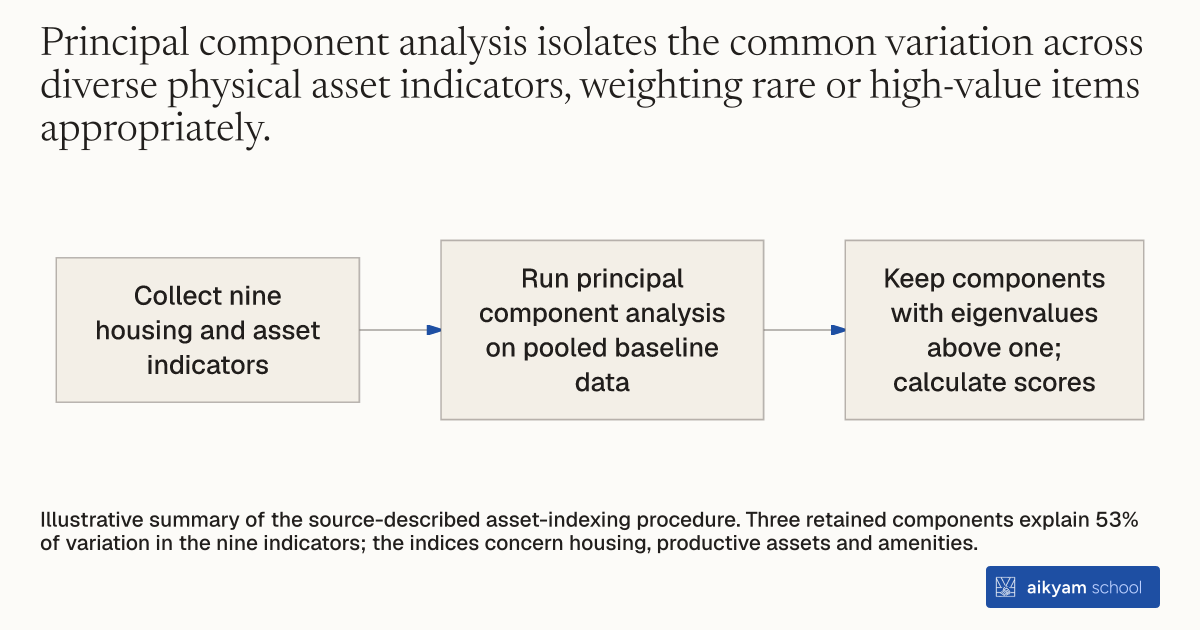
- Collect nine housing and asset indicators
- Run principal component analysis on pooled baseline data
- Keep components with eigenvalues above one; calculate scores
Illustrative summary of the source-described asset-indexing procedure. Three retained components explain 53% of variation in the nine indicators; the indices concern housing, productive assets and amenities.
See source →How
When to use
In rural developing regions, detailed household income or expenditure data are often missing, inaccurate, or costly to collect. Evaluators need a reliable proxy for household socioeconomic status and long-term economic wealth. Aggregating physical asset ownership and housing conditions using principal component analysis constructs standardized wealth indices without relying on income surveys.
Aggregate household asset ownership and housing characteristics into standardized wealth indices using principal component analysis following Filmer and Pritchett (2001).
- Program census takers collect baseline binary and numeric data on housing structural features and physical asset ownership across all target households.
- Econometricians compile a list of core underlying wealth indicators, including wall material, roofing, flooring, latrine access, electricity, room count, radio ownership, work animals, and agricultural sprayers.
- Econometricians run principal component analysis on the pooled baseline sample of target households to extract orthogonal linear combinations of the asset variables.
- Econometricians retain principal components with eigenvalues greater than one to capture the main dimensions of household economic variation.
- Econometricians calculate factor scoring coefficients for each indicator to generate individual index scores for housing characteristics, productive assets, and household amenities.
Why it works
This generates linear indices that proxy long-term household wealth while eliminating reporting noise and measurement error inherent in income or expenditure recall.
Example
In the evaluation of the Nicaraguan Red de Protección Social program, researchers used principal component analysis on baseline census data from 2000 across nine housing and asset variables for households with girls aged 9 to 12. They retained the first three principal components, which jointly explained 53 percent of the total variation, separating household wealth into housing quality, productive assets, and specific amenities.
About the study
Participants
Target sample of households containing girls aged 9 to 12 at baseline across 42 rural comarcas in central and northern Nicaragua.
Study Design
Statistical aggregation of nine baseline census housing and asset variables using principal component analysis following Filmer and Pritchett (2001), retaining components with eigenvalues exceeding 1.0.
Results
Principal component analysis extracted three primary components with eigenvalues greater than one that jointly accounted for 53 percent of the total variance across nine baseline asset indicators.