Research procedure
Build indices from survey indicators
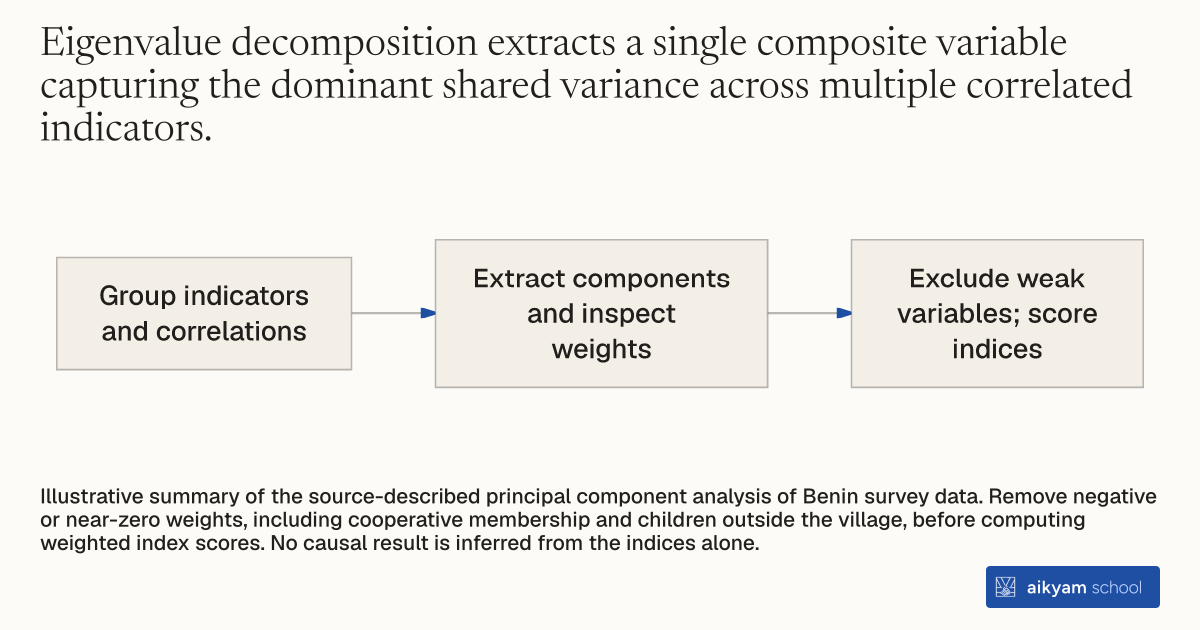
- Group indicators and correlations
- Extract components and inspect weights
- Exclude weak variables; score indices
Illustrative summary of the source-described principal component analysis of Benin survey data. Remove negative or near-zero weights, including cooperative membership and children outside the village, before computing weighted index scores. No causal result is inferred from the indices alone.
See source →How
When to use
Survey evaluations measuring citizen social capital and information access track dozens of correlated indicators across media consumption, organizational memberships, and interpersonal discussions. Including all individual survey indicators directly in econometric regressions creates severe multicollinearity and reduces estimation precision. This method applies to empirical researchers and program evaluators constructing composite network and information indices from multidimensional survey data.
Aggregate correlated social network and media survey variables into orthogonal composite indices using principal component analysis.
- Group individual survey variables into distinct thematic categories based on local social networks, broad media networks, and housing asset quality.
- Calculate the correlation structure across individual indicators within each thematic category.
- Perform eigenvalue-eigenvector decomposition on each variable group to extract the primary factor capturing maximum sample variance.
- Inspect the resulting factor loadings for each candidate variable within the primary component.
- Exclude variables with negative or near-zero factor loadings—such as cooperative membership or living children outside the village—to refine index quality.
- Compute individual respondent index scores from the weighted linear combination of the remaining primary variables.
Why it works
Excluding variables with negative or near-zero factor loadings eliminates noise and avoids multicollinearity in statistical regressions.
Example
In analyzing post-election survey data from 2,534 voters in Benin, researchers used principal component analysis to reduce media usage, organizational ties, and political discussion variables into discrete indices, excluding cooperative membership and distant children due to poor factor loadings.
About the study
Participants
2,534 voting-age adults across 24 rural villages in Benin surveyed in May 2002.
Study Design
Principal component analysis (eigenvalue-eigenvector decomposition) applied to post-election survey indicators to construct composite local network, media, discussion, travel, and housing asset indices used in probit regressions with village-clustered standard errors.
Results
A one standard deviation increase in the media usage index increased voter responsiveness to public goods platforms by 8 to 11.5 percentage points, while a one standard deviation increase in political discussion decreased responsiveness by 6.8 to 10.5 percentage points.