Research steps
Estimate peer effects in two stages
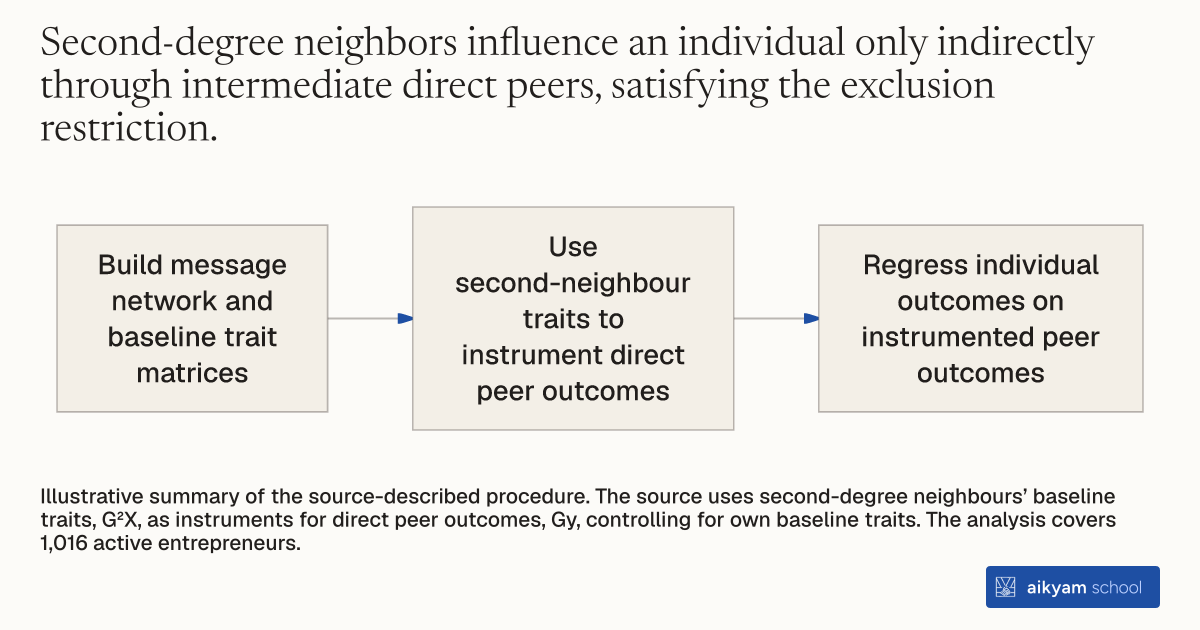
- Build message network and baseline trait matrices
- Use second-neighbour traits to instrument direct peer outcomes
- Regress individual outcomes on instrumented peer outcomes
Illustrative summary of the source-described procedure. The source uses second-degree neighbours’ baseline traits, G²X, as instruments for direct peer outcomes, Gy, controlling for own baseline traits. The analysis covers 1,016 active entrepreneurs.
See source →How
When to use
Researchers and evaluators need to measure direct peer influence within social networks without bias from simultaneous outcomes or network selection. Standard regressions confuse peer impact with shared environments or similar choices. Instrumenting direct peer outcomes using the traits of second-degree neighbors isolates true causal peer effects.
Estimate causal network peer effects using a two-stage instrumental variables model with second-degree neighbor characteristics.
- Construct a weighted social network adjacency matrix representing message flows between every pair of participants.
- Collect exogenous baseline characteristics for all participants from baseline surveys administered before network formation.
- Calculate the matrix product of the squared network adjacency matrix and the baseline characteristics matrix to capture second-degree neighbor traits.
- Estimate a first-stage regression that instruments direct peer outcomes using the weighted baseline characteristics of second-degree neighbors.
- Estimate a second-stage regression of individual participant outcomes on the instrumented direct peer outcomes while controlling for own baseline characteristics.
Why it works
Because second-degree neighbor baseline traits are fixed prior to interaction, they generate exogenous variation in direct peer behavior that is free from reflection bias.
Example
Econometricians evaluated peer influence among 1016 active entrepreneurs across virtual networking groups in 44 African nations. Using baseline traits of second-degree neighbors as instruments, peer submission behavior increased individual proposal submission rates by 53.3 percentage points in nationally homogeneous groups.
About the study
Participants
1016 active entrepreneurs who completed Milestone 0 on time across 44 interaction clusters in virtual treatment arms.
Study Design
Two-stage Instrumental Variable OLS regression using baseline traits of second-degree network neighbors (\\(G^2X\\)) as instruments for direct peer outcomes (\\(Gy\\)) across submission and quality metrics.
Results
In large-country virtual-within networks, peer performance significantly increased proposal submission rates (\\(\beta = 0.533, p < 0.01\\)) and extensive quality (\\(\beta = 0.327, p < 0.05\\)). In small-country virtual-across networks, peer performance significantly increased intensive business proposal quality (\\(\beta = 0.476, p < 0.01\\)) and extensive quality (\\(\beta = 0.537, p < 0.01\\)).