Research steps
Measure responses to spending information
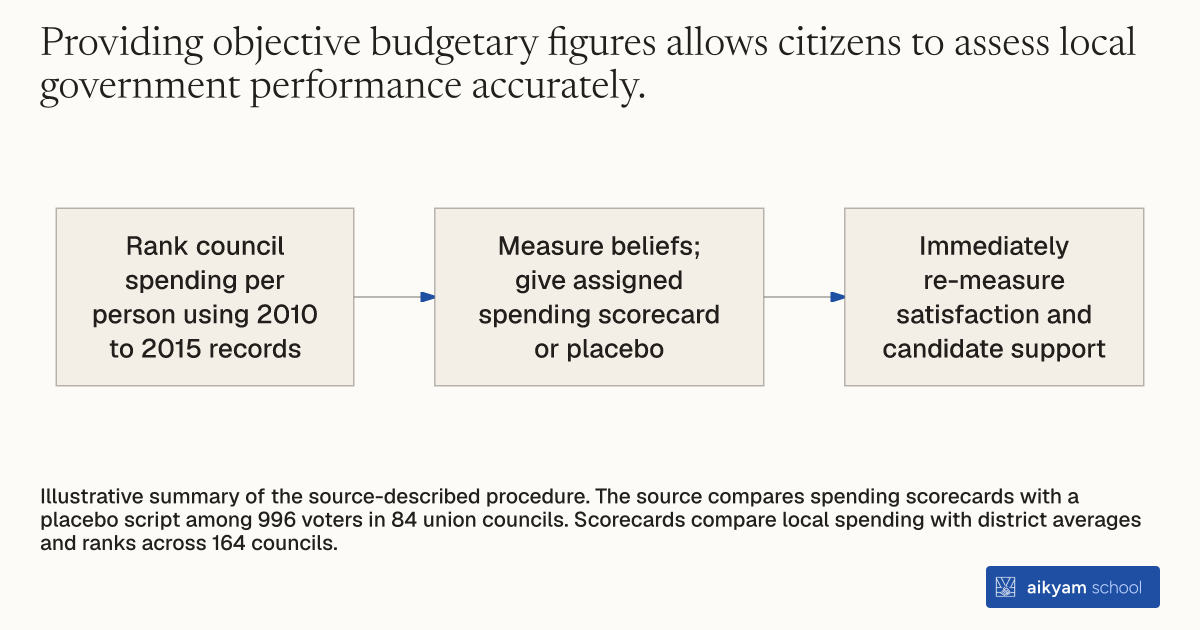
- Rank council spending per person using 2010 to 2015 records
- Measure beliefs; give assigned spending scorecard or placebo
- Immediately re-measure satisfaction and candidate support
Illustrative summary of the source-described procedure. The source compares spending scorecards with a placebo script among 996 voters in 84 union councils. Scorecards compare local spending with district averages and ranks across 164 councils.
See source →How
When to use
In clientelistic polities, incumbent political parties expect voters to reward past public development spending during local elections. However, voters may view pre-election municipal spending as uninformative cheap talk rather than a signal of future politician capacity. This method delivers objective, localized development spending data to voters to evaluate whether transparency about past performance shifts candidate support.
Provide voters with customized, union council-specific scorecards comparing historic government development spending per capita against district averages.
- Collect administrative development expenditure records from 2010 to 2015 across district municipal departments in Sargodha.
- Calculate per-capita spending for each union council and rank them into performance quintiles relative to all 164 rural union councils in the district.
- Elicit baseline voter beliefs about local spending and candidate support using pre-election household surveys.
- Prepare personalized scorecards and bar charts displaying the union council's per-capita spending in rupees, spending rank out of 164 councils, and total expenditure compared to district averages.
- Deliver the printed spending scorecard to treated voters during a pre-election household survey visit.
- Re-measure voter satisfaction with public services and expressed candidate support immediately after scorecard delivery.
Why it works
However, because local development spending does not indicate a local candidate's ability to access higher-tier political networks, spending information alters service satisfaction without changing vote preferences.
Example
Researchers delivered public spending scorecards to 996 registered voters across 84 rural union councils in Sargodha district in November 2015, finding that while spending information increased government satisfaction in top-funded councils, it had no statistically significant impact on candidate vote preferences.
About the study
Participants
996 registered voters across 84 rural union councils in Sargodha district, Punjab province, Pakistan.
Study Design
Randomized survey field experiment using stratified sampling by union council and gender, comparing public spending scorecards against a placebo control script.
Results
Spending information increased the probability that expressed satisfaction with government performance increased by 4.5 percentage points overall and 7.1 percentage points in top-performing councils, but had no statistically significant effect on support for ruling party candidates.