Research procedure
Map flood exposure before comparing adoption
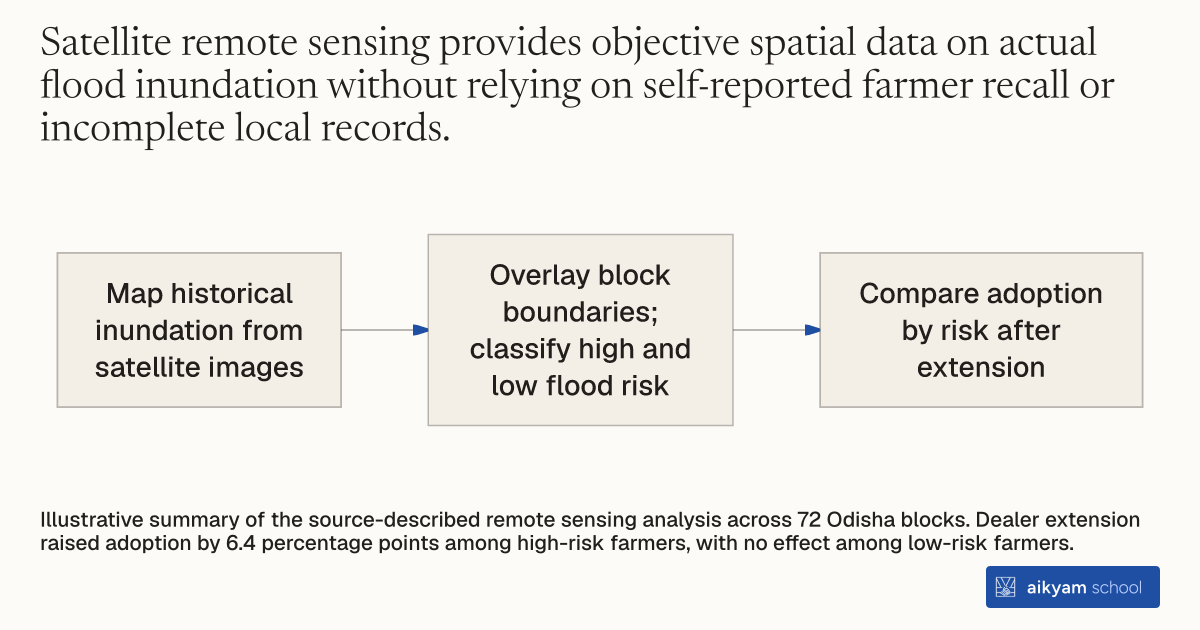
- Map historical inundation from satellite images
- Overlay block boundaries; classify high and low flood risk
- Compare adoption by risk after extension
Illustrative summary of the source-described remote sensing analysis across 72 Odisha blocks. Dealer extension raised adoption by 6.4 percentage points among high-risk farmers, with no effect among low-risk farmers.
See source →How
When to use
Smallholder agricultural populations face varying levels of climate risk across geography, but extension services often distribute stress-tolerant technologies uniformly. Blanket distribution wastes resources on low-risk farmers who do not benefit from flood resilience. Using satellite remote sensing imagery allows evaluators and program managers to map specific high-risk flood inundation zones and accurately direct climate-resilient technologies to vulnerable farmers.
Identify and target vulnerable agricultural areas using satellite remote sensing technology to map local flood risk profiles.
- Acquire historical high-resolution satellite remote sensing imagery covering target agricultural districts.
- Analyze spatial inundation patterns across administrative blocks to classify local flood risk exposure levels.
- Overlay satellite flood maps onto administrative block boundaries containing local farming communities.
- Categorize study blocks into high-risk flood zones and low-risk flood zones based on observed historical water coverage.
- Direct specialized stress-tolerant seed distribution and extension services specifically toward high-risk flood blocks to optimize technology impact.
Why it works
Categorizing geography by verified risk ensures that specialized climate-adaptation technologies reach the populations facing actual yield losses.
Example
Researchers used satellite remote sensing imagery to measure historical flood risk across 72 administrative blocks in coastal Odisha, India. Evaluating extension interventions against these remote sensing maps revealed that agro-dealer extension increased Swarna-Sub1 adoption by 6.4 percentage points among high-risk flood-exposed farmers, while low-risk farmers experienced no adoption effect.
About the study
Participants
72 administrative blocks comprising about 136 villages each across 10 flood-prone coastal districts in Odisha, India.
Study Design
Remote sensing spatial mapping combined with a randomized controlled trial across 72 blocks, measuring adoption differentials between satellite-classified high-risk and low-risk flood areas following extension interventions.
Results
Remote sensing classification showed that agro-dealer extension boosted Swarna-Sub1 adoption by 6.4 percentage points among high-risk farmers, while generating a 0 percentage point adoption change among low-risk farmers who faced no flood threat.