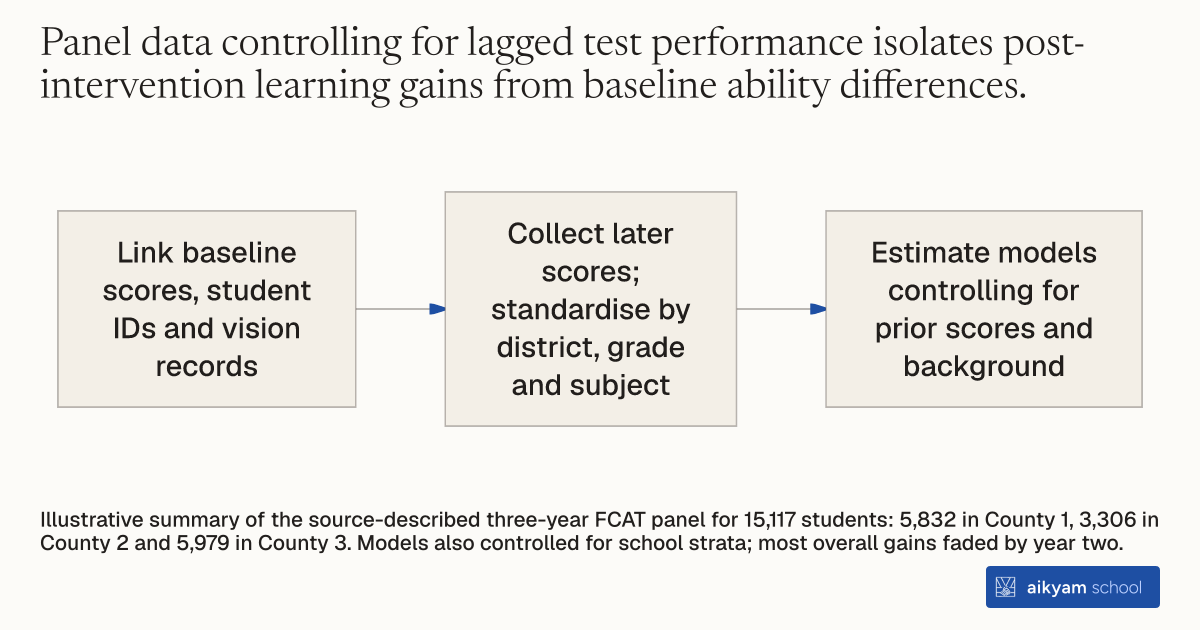
Research steps
Link health services with test score panels
- Link baseline scores, student IDs and vision records
- Collect later scores; standardise by district, grade and subject
- Estimate models controlling for prior scores and background
Illustrative summary of the source-described three-year FCAT panel for 15,117 students: 5,832 in County 1, 3,306 in County 2 and 5,979 in County 3. Models also controlled for school strata; most overall gains faded by year two.
See source →How
When to use
Evaluating school health programs requires objective measurements of academic progress over time. Unobserved differences between students and historical score trajectories can obscure the true impact of non-academic interventions. Linking multi-year standardized test score panels to individual health screening records measures annual learning gains across subjects and subgroups.
Construct a student-level longitudinal test score panel linked with health screening records to measure school program impacts.
- Obtain baseline standardized reading and mathematics test scores from district administrative records for all target elementary students prior to program start.
- Link student health screening and mobile exam results directly to student administrative identification numbers.
- Collect annual standardized achievement test scores across subsequent post-intervention school years.
- Normalize continuous test scale scores into standardized z-scores with mean zero and unit variance within district, grade, and subject.
- Estimate regression models controlling for prior-year test scores, baseline school strata, and student demographic characteristics to isolate learning gains.
Why it works
Standardizing test scores allows consistent comparison across different grade levels and testing years.
Example
Researchers compiled three years of FCAT panel scores for 15,117 students in Title 1 elementary schools across three central Florida districts to measure math and reading score changes following vision screenings and free eyeglasses provision.
About the study
Participants
15,117 students in Title 1 elementary schools across three central Florida school districts (5,832 in County 1, 3,306 in County 2, and 5,979 in County 3).
Study Design
Student-level panel data regression linking FCAT reading and math scores across pre- and post-intervention years, controlling for prior test scores, school strata, and student demographics.
Results
Panel analysis revealed 5th-grade math score gains of 0.14 to 0.16 SD and reading gains of 0.11 SD in full-treatment schools, while showing that most overall test gains faded out by year two except for English Language Learner math gains (0.08 SD).