Research steps
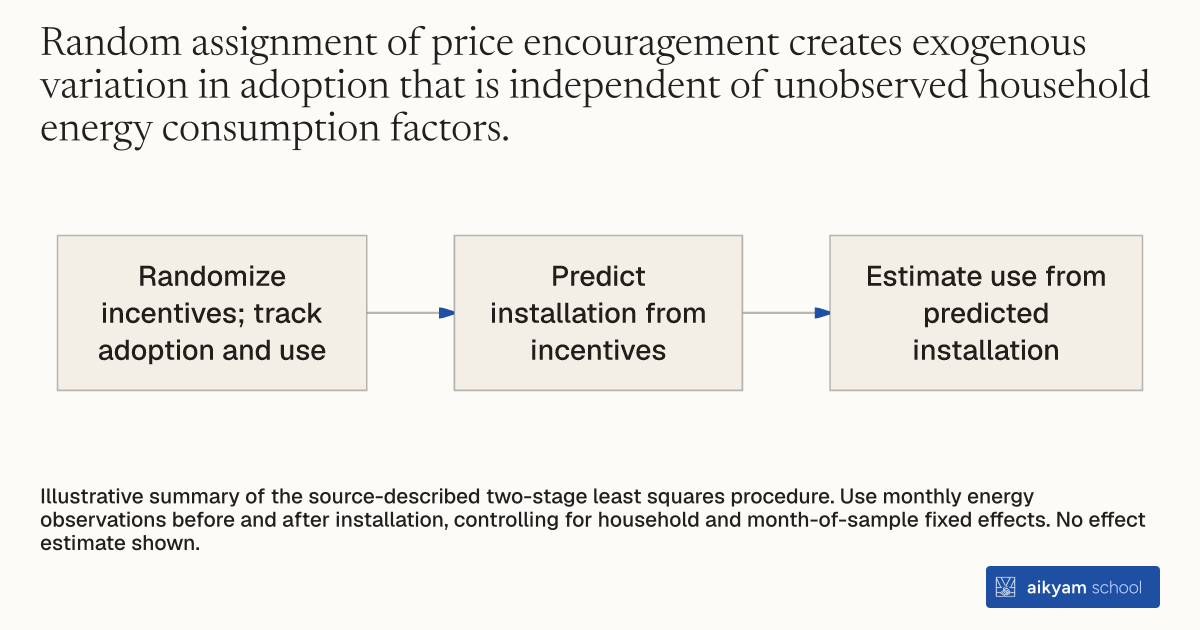
Estimate adoption effects in two stages
- Randomize incentives; track adoption and use
- Predict installation from incentives
- Estimate use from predicted installation
Illustrative summary of the source-described two-stage least squares procedure. Use monthly energy observations before and after installation, controlling for household and month-of-sample fixed effects. No effect estimate shown.
See source →How
When to use
Evaluating the true impact of adopting new technology is difficult when households voluntarily choose to participate. Voluntary choices create selection bias that distorts energy consumption estimates. Using randomized financial incentives as an encouragement instrument removes selection bias to measure unbiased usage changes.
Estimate the local average treatment effect of technology adoption on energy usage using randomized price incentives as an instrumental variable in a two-stage least squares model.
- Assign households randomly to receive varying price encouragement incentives for technology adoption during an initial direct mail campaign.
- Record actual technology adoption and meter installation outcomes for encouraged and control households.
- Collect longitudinal monthly household energy usage observations before and after meter installations.
- Estimate a first-stage regression predicting meter installation using the assigned price incentives as the instrumental variable.
- Estimate a second-stage regression using predicted installation values to measure energy usage changes while controlling for household and month-of-sample fixed effects.
Why it works
Second-stage estimation isolates the unbiased causal effect of technology adoption among households prompted by the price incentive.
Example
Researchers used randomized £5 and £10 price incentives to instrument smart meter installations across 39,133 British Gas households, finding that smart meters produced no statistically significant change in monthly electricity (-1.29 to -4.13 kWh) or gas usage (+1.73 to +80.54 kWh).
About the study
Participants
39,133 residential British Gas utility customers with over 1,200,000 monthly usage observations across 36 post-adoption months in the United Kingdom.
Study Design
Two-stage least squares (2SLS) instrumental variables framework using randomized price encouragement incentives to estimate the Local Average Treatment Effect (LATE) on monthly electricity and gas consumption with household and month-of-sample fixed effects.
Results
Smart meter adoption produced statistically non-significant Local Average Treatment Effects ranging from -4.13 kWh to -1.29 kWh per month for electricity (0.4% to 1.4% reduction, standard errors 16.6 to 24.0) and non-significant gas usage changes up to +80.54 kWh per month.