Research steps
Use lottery offers to estimate participation effects
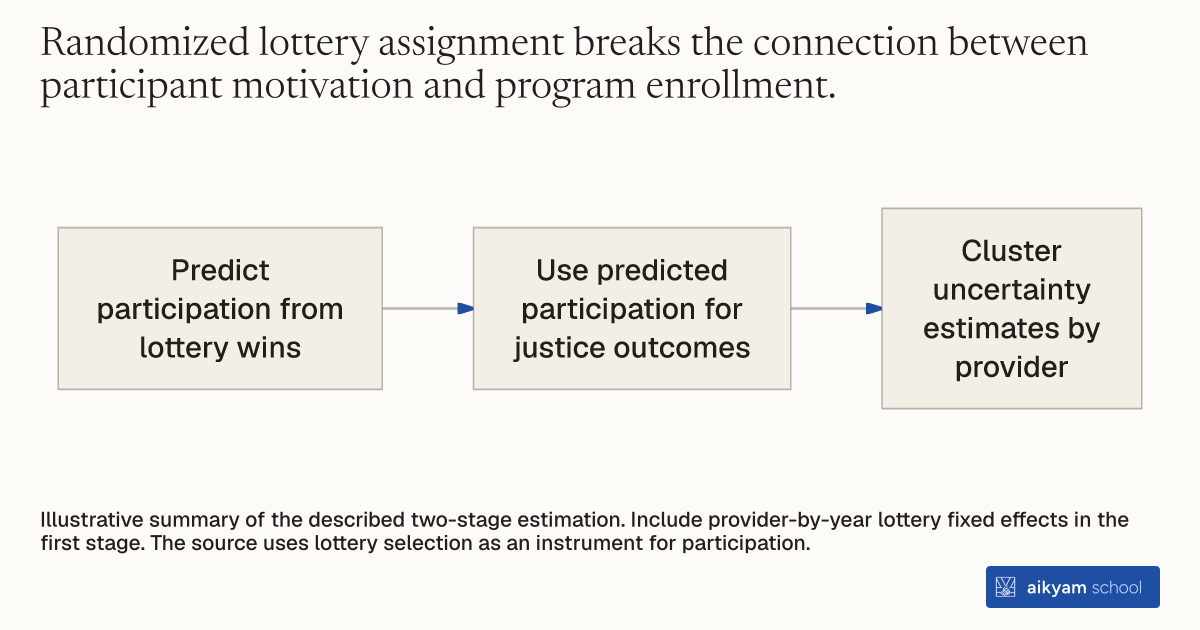
- Predict participation from lottery wins
- Use predicted participation for justice outcomes
- Cluster uncertainty estimates by provider
Illustrative summary of the described two-stage estimation. Include provider-by-year lottery fixed effects in the first stage. The source uses lottery selection as an instrument for participation.
See source →How
When to use
Unobserved differences like personal motivation make simple comparisons between employed and unemployed youth unreliable. Using randomized job lottery selection as a statistical instrument isolates true causal program effects on criminal justice contact. This method serves evaluators measuring public program impacts on oversubscribed populations.
Estimate causal treatment effects using randomized lottery selection offers as an instrumental variable in a two-stage least squares model.
- Define a binary instrumental variable indicating whether an applicant won a randomized program lottery.
- Formulate a first-stage linear regression predicting program participation from lottery winning status while controlling for provider-by-year lottery fixed effects.
- Compute predicted program participation values from the first-stage estimation.
- Formulate a second-stage linear regression modeling criminal justice outcomes using the predicted participation values.
- Calculate robust standard errors clustered at the provider level to report unconfounded local average treatment effects.
Why it works
Using lottery winning status as an instrument isolates the portion of participation driven purely by chance, eliminating selection bias.
Example
Researchers evaluated 163,447 New York City youth applicants across 2005 to 2008 lotteries using two-stage least squares instrumental variables. Winning a lottery increased program participation by 68.98 percentage points in the first stage. Second-stage estimates showed that program participation reduced summer arrests by 17 percent (0.128 percentage points) and summer convictions by 31 percent (0.0752 percentage points).
About the study
Participants
163,447 youth applicants (91,908 lottery winners and 71,539 lottery losers aged 16 to 21), New York City.
Study Design
Two-stage least squares instrumental variable estimation using lottery selection to instrument for SYEP participation, controlling for provider-year fixed effects and clustering standard errors by provider.
Results
The first stage showed a strong instrument with F-statistics between 2,400 and 3,600 (first-stage coefficient of 0.6898, p < 0.01). Second-stage estimates demonstrated a 0.128 percentage point drop in summer arrests (17 percent) and a 0.0752 percentage point drop in summer convictions (31 percent).