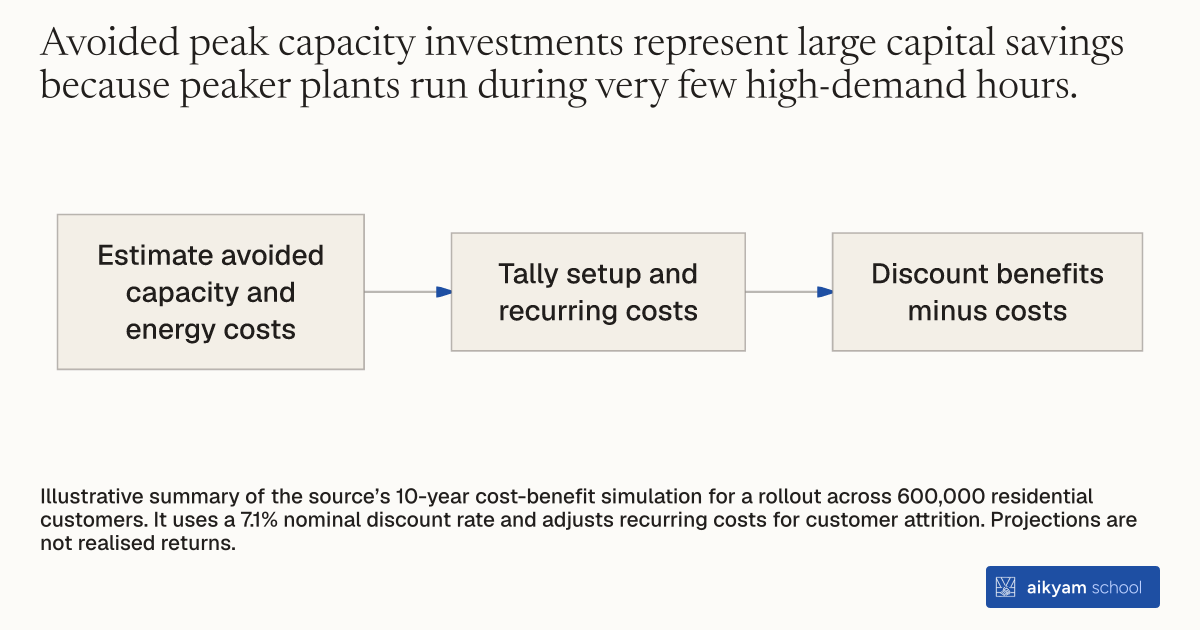
Research procedure
Project utility costs and benefits
- Estimate avoided capacity and energy costs
- Tally setup and recurring costs
- Discount benefits minus costs
Illustrative summary of the source’s 10-year cost-benefit simulation for a rollout across 600,000 residential customers. It uses a 7.1% nominal discount rate and adjusts recurring costs for customer attrition. Projections are not realised returns.
See source →How
When to use
Public electric utilities need to determine whether time-varying rate programs justify their fixed and recurring implementation costs. Deploying dynamic pricing requires substantial upfront billing software updates, marketing outreach, and customer support. Conducting a ten-year net present value cost-benefit analysis compares avoided generation and capacity expenses against program expenditures to guide utility investment decisions.
Calculate ten-year net present value benefits and costs for dynamic pricing programs scaled across a utility customer base.
- Financial analysts project avoided generation capacity investment costs by multiplying hourly customer load reductions by the estimated annual cost of peaker plant construction.
- Financial analysts project avoided energy generation costs by multiplying hourly customer kilowatt-hour reductions by wholesale energy spot prices.
- Administrative staff tally one-time fixed IT billing and program design expenditures.
- Marketing staff calculate one-time variable customer acquisition and in-home display provision costs across enrolled households.
- Operations staff calculate recurring annual administrative, customer service, and equipment monitoring expenses adjusted for annual customer attrition.
- Financial analysts sum total discounted benefits and subtract total discounted costs over a ten-year horizon using a 7.1 percent nominal discount rate.
Why it works
Scaling enrollment through default opt-out mechanisms spreads fixed software and administrative overhead over a massive customer base, driving positive net financial returns.
Example
SMUD evaluated a 10-year scaled rollout across 600,000 residential customers in Sacramento, California, finding that CPP opt-out generated $55.4 million in net benefits and TOU opt-out generated $23.0 million in net benefits, whereas TOU opt-in produced a net loss of -$0.5 million.
About the study
Participants
Projected across 600,000 residential utility customers in Sacramento, California over a 10-year horizon.
Study Design
10-year Net Present Value (NPV) cost-benefit simulation using a 7.1 percent nominal discount rate and 4.5 percent real discount rate.
Results
CPP opt-out yielded $94.2 million in total benefits and $38.8 million in total costs for a $55.4 million net benefit, while TOU opt-in yielded $32.0 million in total benefits and $32.5 million in total costs for a -$0.5 million net loss.