In Simple Words
Imagine trying to test whether a new training program works by enrolling only 17 sports teams instead of thousands of individual athletes. Because 17 is too small a number to rely on standard statistical averages, researchers collect detailed performance stats on every team every week for two full years, and mathematically shuffle all possible team assignments 12,376 times to ensure that any observed victory was caused by the training and not by luck.
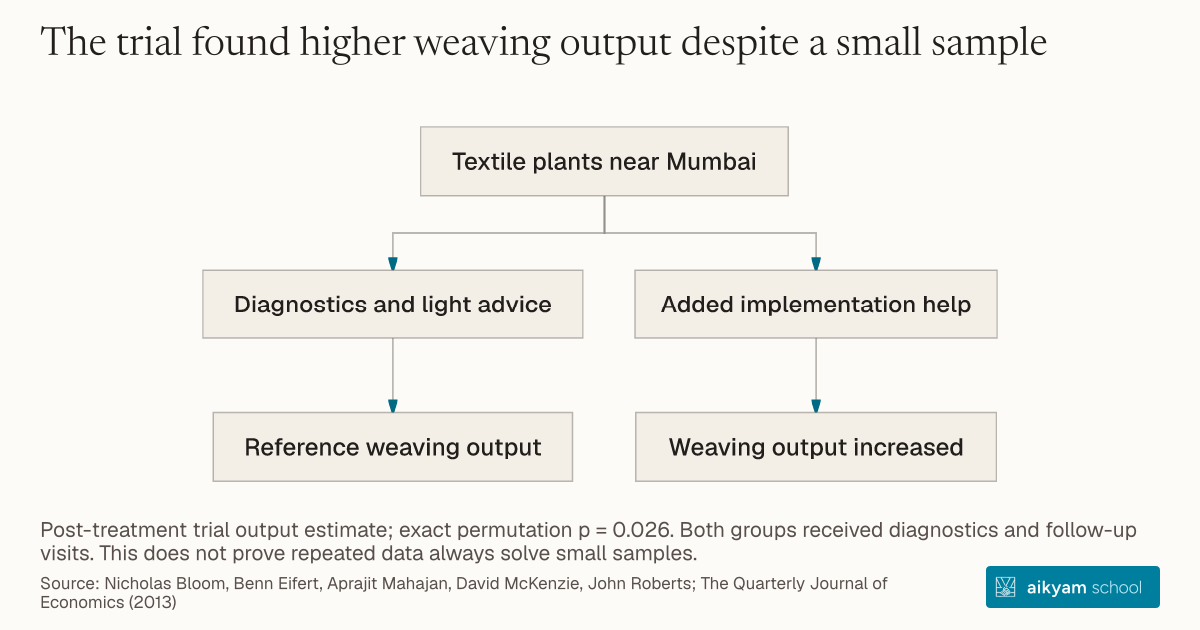
Textile plants near Mumbai
- Diagnostics and light advice
- Reference weaving output
- Added implementation help
- Weaving output increased
Post-treatment trial output estimate; exact permutation p = 0.026. Both groups received diagnostics and follow-up visits. This does not prove repeated data always solve small samples.
See source →Research question
Field experiments conducted on large, complex organizations often suffer from severe sample size constraints because recruiting major corporate subjects is difficult and expensive. Standard asymptotic statistical tests fail when the cross-sectional count of firms is small, risking invalid inference or high susceptibility to outlier distortion.
Participants
20 experimental plants across 17 multiplant woven cotton fabric manufacturing firms near Mumbai, India, tracked across ~100 weekly observations per plant.
Study Design
Randomized controlled trial combining exact permutation tests across all 12,376 possible treatment assignment combinations with Ibragimov-Mueller (2010) t-statistic procedures that exploit large time-series asymptotics (large T, small N).
Results
Intention-To-Treat (ITT) permutation tests demonstrated statistically significant reductions in quality defects (p = 0.001) and output increases (p = 0.026), proving that high-frequency weekly panel data compensates for small cross-sectional sample size.
Takeaway
Collect high-frequency repeated measurements over extended time horizons when running interventions on small sample populations to achieve sufficient statistical power and exact inference.
Source and citation
See source →Read alongside the research
Plain-English glossary
Original explanations, informed by the references below. Examples are illustrations, not data from the studies above. The research text stays unchanged.
- Randomized controlled trial
A study that uses chance, like drawing lots, to decide who receives each option being compared. Researchers compare the groups’ outcomes to estimate the effect of those options.
ExampleA lottery assigns volunteers to a training programme or a comparison group. Researchers then compare their outcomes.
GET-IT glossary · Randomized study ↗Read more about randomized controlled trial →- Statistically significant
A label used when a result passes a chosen statistical threshold, often p < 0.05. It does not show how large or useful an effect is. A result that is not statistically significant does not prove there is no effect.
ExampleA study reports p = 0.03 against a 0.05 threshold. It passes that test, but the effect could still be too small to matter.
American Statistical Association · Statement on p-values ↗Read more about statistically significant →