Research overview
Measure assets against cumulative prizes
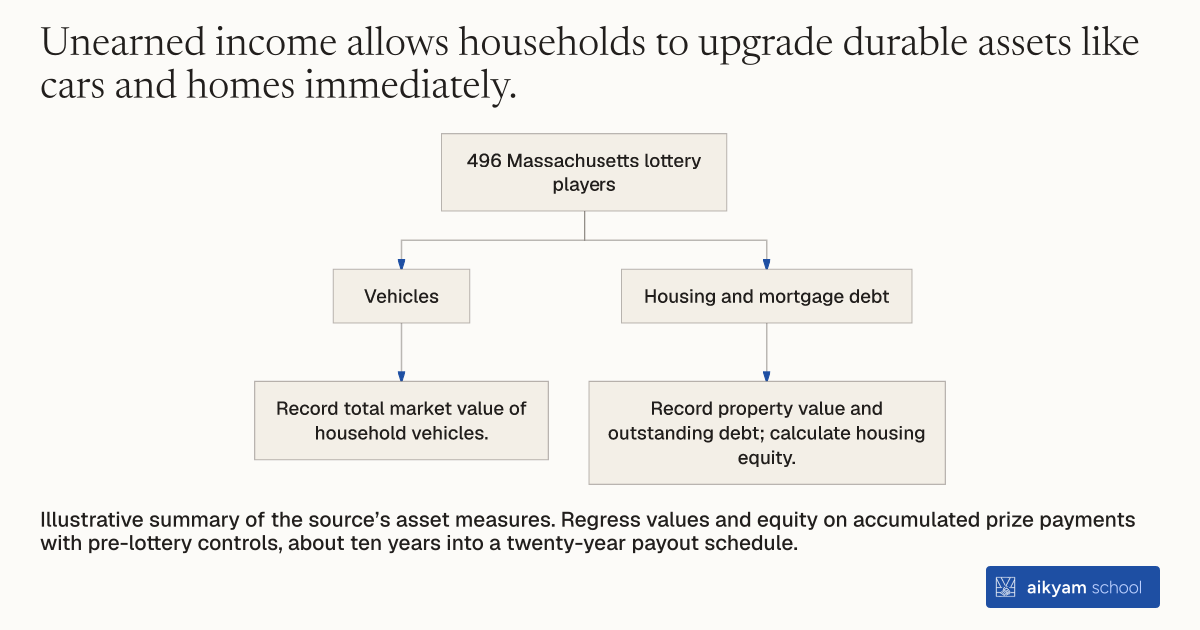
496 Massachusetts lottery players
- Vehicles
- Record total market value of household vehicles.
- Housing and mortgage debt
- Record property value and outstanding debt; calculate housing equity.
Illustrative summary of the source’s asset measures. Regress values and equity on accumulated prize payments with pre-lottery controls, about ten years into a twenty-year payout schedule.
See source →How
When to use
Researchers and economists need to measure how households allocate unearned cash transfers toward major physical assets. Surveying current asset values without accounting for financing choices masks the actual cash spent on durables. Estimating cumulative expenditures on housing and vehicles reveals real consumption choices out of unearned wealth.
Regress self-reported vehicle and housing asset values alongside mortgage debt on accumulated multi-year unearned payments.
- Survey respondents on the total market value of all vehicles owned by the household.
- Record the reported total value of primary housing real estate owned by respondents.
- Collect total outstanding mortgage debt and home loan balances held against housing real estate.
- Calculate accumulated unearned lottery prize payments received by each winner up to the survey date.
- Regress vehicle values, real estate values, and net housing equity on cumulative prize payments using linear OLS models while controlling for pre-lottery baseline characteristics.
Why it works
Estimating net housing equity alongside gross values accounts for debt taken on to buy larger homes.
Example
Researchers evaluated 496 Massachusetts lottery players who received multi-year prize installments to estimate durable consumption spending. Lottery winners spent 1.4 percent of accumulated prize payouts on car values and 3.7 percent on housing values, while mortgage debt increased by 3.8 percent of accumulated prizes.
About the study
Participants
496 lottery players (259 nonwinners and 237 winners; 194 small winners receiving under 100,000 dollars per year) in Massachusetts.
Study Design
Cross-sectional OLS regressions of vehicle values, housing values, and mortgage debts on cumulative lottery payments received approximately 10 years into a 20-year payout schedule.
Results
Cumulative unearned income increased car values with a marginal propensity to consume of 0.014 (standard error 0.007) and housing values by 0.037 (standard error 0.021), offset by a mortgage debt increase of 0.038 (standard error 0.019).