Research procedure
Measure risk preferences
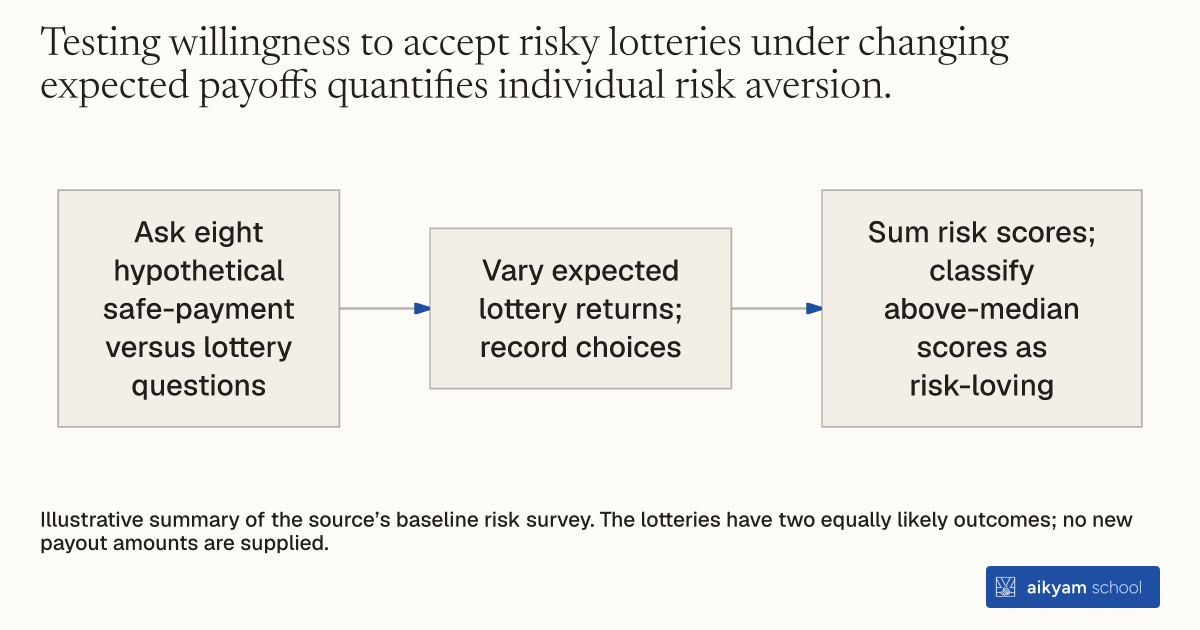
- Ask eight hypothetical safe-payment versus lottery questions
- Vary expected lottery returns; record choices
- Sum risk scores; classify above-median scores as risk-loving
Illustrative summary of the source’s baseline risk survey. The lotteries have two equally likely outcomes; no new payout amounts are supplied.
See source →How
When to use
Low-income microfinance borrowers exhibit varying levels of risk aversion that dictate their willingness to invest in risky, high-return business assets. Lenders and researchers need to identify client risk attitudes before disbursing debt contracts to understand project choices. Administering a structured risk preference index identifies risk-averse entrepreneurs who benefit most from flexible repayment schedules.
Measure client risk attitudes by presenting eight hypothetical lottery choices between guaranteed returns and risky returns with varying payoffs.
- Administer an eight-question survey module to microfinance clients during baseline data collection.
- Present eight distinct choices between a guaranteed cash payment and a lottery with two equal outcomes.
- Vary expected returns of the lottery option across the eight questions to test willingness to take financial risks.
- Record whether the client chooses the safe return or the risky lottery for each question.
- Calculate a cumulative risk index score and classify clients with scores above the sample median as risk-loving.
Why it works
Identifying client risk preferences allows lenders to predict which entrepreneurs need grace periods to undertake illiquid investments.
Example
Survey enumerators evaluated risk preferences among 713 female microfinance clients in Kolkata using an eight-question lottery survey module. The survey classified 51.5 percent of clients as risk-loving and 48.5 percent as risk-averse, revealing that risk-averse clients in the grace period group achieved 92.0 percent higher monthly profits.
About the study
Participants
713 low-income female microfinance clients in Kolkata, India across regular and grace period loan groups.
Study Design
Baseline survey experiment measuring risk attitudes using an eight-question lottery choice index and analyzing long-run weekly profit differences across risk categories.
Results
51.5 percent of clients were classified as risk-loving and 48.5 percent as risk-averse; risk-averse grace period clients achieved 92.0 percent higher weekly profits (1,543.6 rupees higher profits, p < 0.05), whereas risk-loving grace period clients experienced no statistically significant profit increase.