Research steps
Prepare health register data for analysis
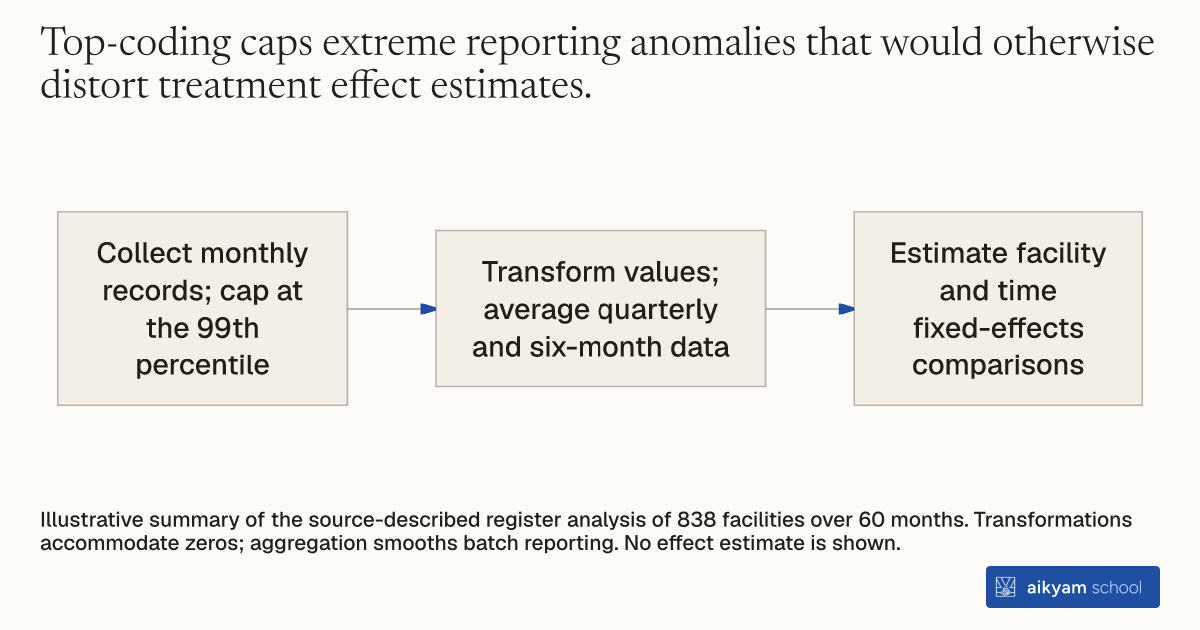
- Collect monthly records; cap at the 99th percentile
- Transform values; average quarterly and six-month data
- Estimate facility and time fixed-effects comparisons
Illustrative summary of the source-described register analysis of 838 facilities over 60 months. Transformations accommodate zeros; aggregation smooths batch reporting. No effect estimate is shown.
See source →How
When to use
In public health program evaluations, administrative health facility data often contain missing entries, extreme reporting spikes, and zero values caused by quarterly reporting aggregation. Program analysts need to evaluate longitudinal monthly health commodity distribution without letting reporting noise distort impact estimates. Trimming extreme outliers and aggregating high-frequency register data cleans administrative panels for impact evaluation.
Top-code extreme values and aggregate monthly administrative facility records to reduce reporting noise and missingness in health register panels.
- Collect monthly commodity distribution records across all health facilities operating within target broadcast zones over a multi-year panel period.
- Identify extreme monthly distribution spikes and top-code values at the 99th percentile across all reporting periods.
- Replace raw zeros with log or inverse hyperbolic sine transformations to accommodate skewed distributions while retaining zero-volume observations.
- Average monthly distribution counts into quarterly and six-month time intervals to smooth quarterly batch reporting noise.
- Estimate difference-in-differences panel regressions using facility and time-period fixed effects on the smoothed dataset.
Why it works
Aggregating monthly figures into quarterly averages accounts for delayed batch entry where clinics log several months of distribution in a single month.
Example
In Burkina Faso, evaluators processed 60 months of administrative distribution data across 838 health centers covering 5.1 million people in 16 radio broadcast clusters. Analysts top-coded monthly records at the 99th percentile and aggregated observations into quarterly averages to smooth reporting spikes. This data cleaning revealed an 11 percent increase in monthly injectable distributions in campaign zones.
About the study
Participants
838 Ministry of Health facilities with 60 monthly observations across 16 radio station broadcast zones covering 5.1 million people in Burkina Faso.
Study Design
Panel fixed-effects difference-in-differences analysis combining 99th percentile top-coding and quarterly time aggregation.
Results
Top-coding and quarterly aggregation showed administrative injectable distributions increased by 2.6 units per month (+11 percent) and oral pill distributions increased by 3.0 units per month (+21 percent).