Research design
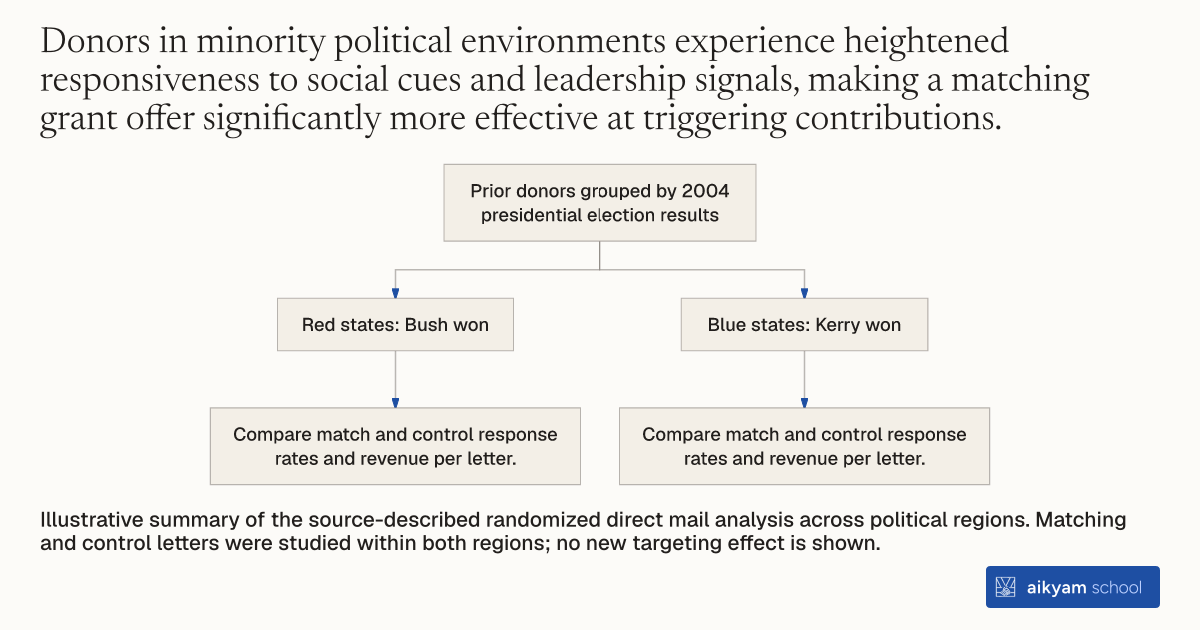
Compare matching offers by state politics
Prior donors grouped by 2004 presidential election results
- Red states: Bush won
- Compare match and control response rates and revenue per letter.
- Blue states: Kerry won
- Compare match and control response rates and revenue per letter.
Illustrative summary of the source-described randomized direct mail analysis across political regions. Matching and control letters were studied within both regions; no new targeting effect is shown.
See source →How
When to use
Charities solicit donations across diverse geographic regions with varying political environments. Response rates and incentive sensitivity can differ significantly depending on the prevailing local political climate. Segmenting campaigns by macro political geography allows organizations to focus price subsidies where donors are most responsive.
Segment direct mail solicitation lists using state-level electoral results to target matching grant offers.
- Obtain state-level presidential election voting records to classify target geographic areas into red (Republican-leaning) and blue (Democratic-leaning) states.
- Cross-reference past donor address lists with state political classifications.
- Deploy matching grant direct mail solicitations primarily to prior donors residing in red states.
- Send standard direct mail solicitations without matching offers to prior donors in blue states.
- Track response rates and total revenue per letter separately across state political segments after one month.
Example
A liberal civil liberties nonprofit in the United States mailed solicitations to prior donors across all 50 states, tracking results across red states (won by George W. Bush in 2004) and blue states (won by John Kerry). In red states, the matching offer increased response rate from 1.5 percent to 2.3 percent and revenue per letter by 55 percent (from \$0.69 to \$1.06), whereas in blue states the match had virtually no effect (2.0 percent control vs. 2.1 percent treatment).
About the study
Participants
49,956 prior donors to a US civil liberties nonprofit, categorized into 20,242 red state recipients (6,648 control, 13,594 treatment) and 29,806 blue state recipients (10,029 control, 19,777 treatment).
Study Design
Randomized natural field trial analyzing direct mail matching grant responsiveness across red and blue states based on 2004 presidential election results.
Results
Probit regressions showed a statistically significant interaction between the matching treatment and red state residence (0.009 coefficient, p < 0.01), boosting revenue per letter by 55 percent in red states (\$0.69 to \$1.06) while leaving blue state revenue virtually unchanged (\$0.90 to \$0.89).