Research steps
Compare costs at different programme sizes
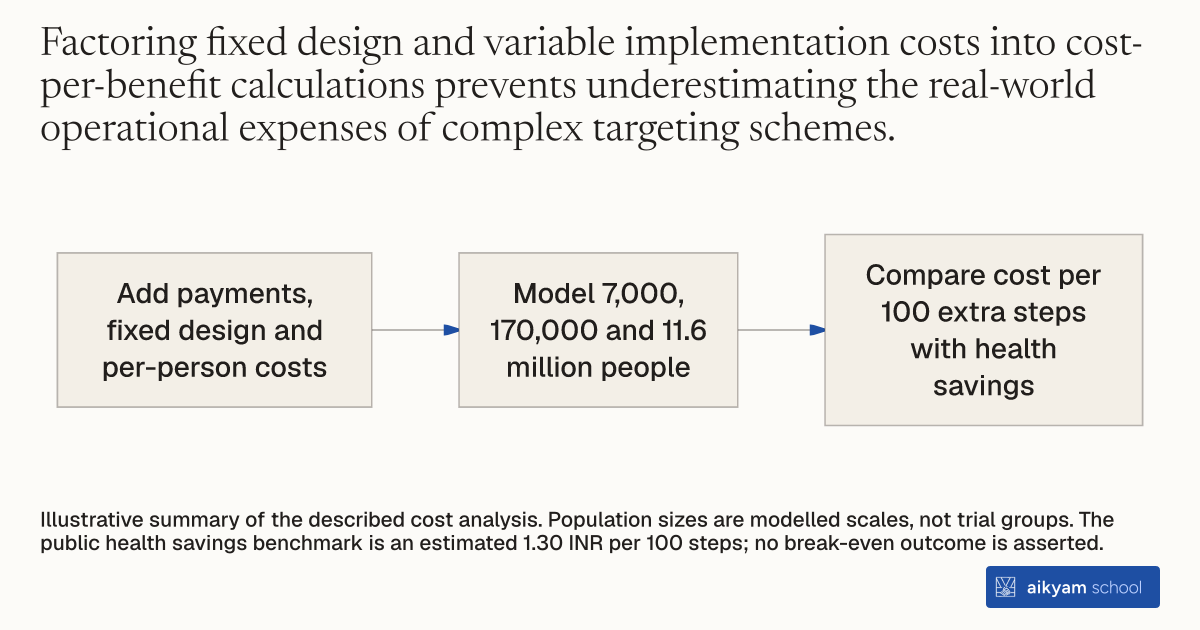
- Add payments, fixed design and per-person costs
- Model 7,000, 170,000 and 11.6 million people
- Compare cost per 100 extra steps with health savings
Illustrative summary of the described cost analysis. Population sizes are modelled scales, not trial groups. The public health savings benchmark is an estimated 1.30 INR per 100 steps; no break-even outcome is asserted.
See source →How
When to use
When evaluating or scaling health incentive policies, administrators must account for fixed design costs and per-person implementation expenses alongside direct payment costs. Simple payment comparisons ignore the setup and administrative burdens that arise when personalizing contracts across different target populations. Evaluating total costs per unit of health benefit across multiple population scales identifies whether personalized choice mechanisms remain cost-effective under real-world operational constraints.
Calculate the net cost-effectiveness of policy personalization mechanisms by combining direct incentive payments, fixed design expenses, and per-participant implementation costs across varying program scales.
- Estimate direct incentive payment costs per participant from daily target compliance and step tracking data.
- Measure fixed design costs, including pre-trial pilot studies required to gather preference data for choice menu construction or preliminary trial data needed for machine learning algorithms.
- Calculate variable per-person implementation costs based on field staff time required to administer survey choice menus, measure baseline covariates, or sync tracking devices.
- Estimate total net expenditure across policy-relevant population scale tiers, such as local annual diagnoses (7,000 people), citywide targets (170,000 people), and regional state scale-ups (11.6 million people).
- Compare total cost per 100 additional steps generated against independent estimates of public fiscal health savings (such as 1.30 INR per 100 steps) to determine scale break-even thresholds.
Why it works
Choice menus amortize fixed design costs rapidly across larger population scales without incurring the heavy per-person data collection costs of complex tagging schemes.
Example
In Coimbatore and Tamil Nadu, India, researchers evaluated incentive contract mechanisms across 7,000, 170,000, and 11.6 million participant scales, finding that Choice generated 100 additional daily steps for 1.01 INR at 7,000 participants (below the 1.30 INR median public health benefit) and dropped to 0.32 INR at 170,000 participants, while machine learning tagging cost 20.29 INR per 100 additional steps at 7,000 participants due to high data collection costs.
About the study
Participants
Cost-effectiveness calculations modeled for sample sizes of 7,000 participants (annual newly diagnosed diabetics in Coimbatore), 170,000 participants (all diabetics in Coimbatore), and 11.6 million participants (all diabetics in Tamil Nadu, India) based on an RCT sample of 6,882 adults aged 30 to 65.
Study Design
Benefit-cost and breakeven administrative analysis combining experimental payment data, ex-post field team time auditing, and public health cost-of-illness estimates from published literature.
Results
At 7,000 participants, Choice generated 100 extra steps for 0.83 INR (payments + design) and 1.01 INR (all costs including 21 INR per-person implementation), breaking even with the median public health benefit of 1.30 INR per 100 steps at 26,800 participants, whereas All Variables Tagging cost 20.29 INR per 100 steps at 7,000 participants due to 18,946,000 INR design costs and 88 INR per-person implementation costs.